Football / sports finance
Football's transfer money is spreading out, not concentrating — and youth carries no premium
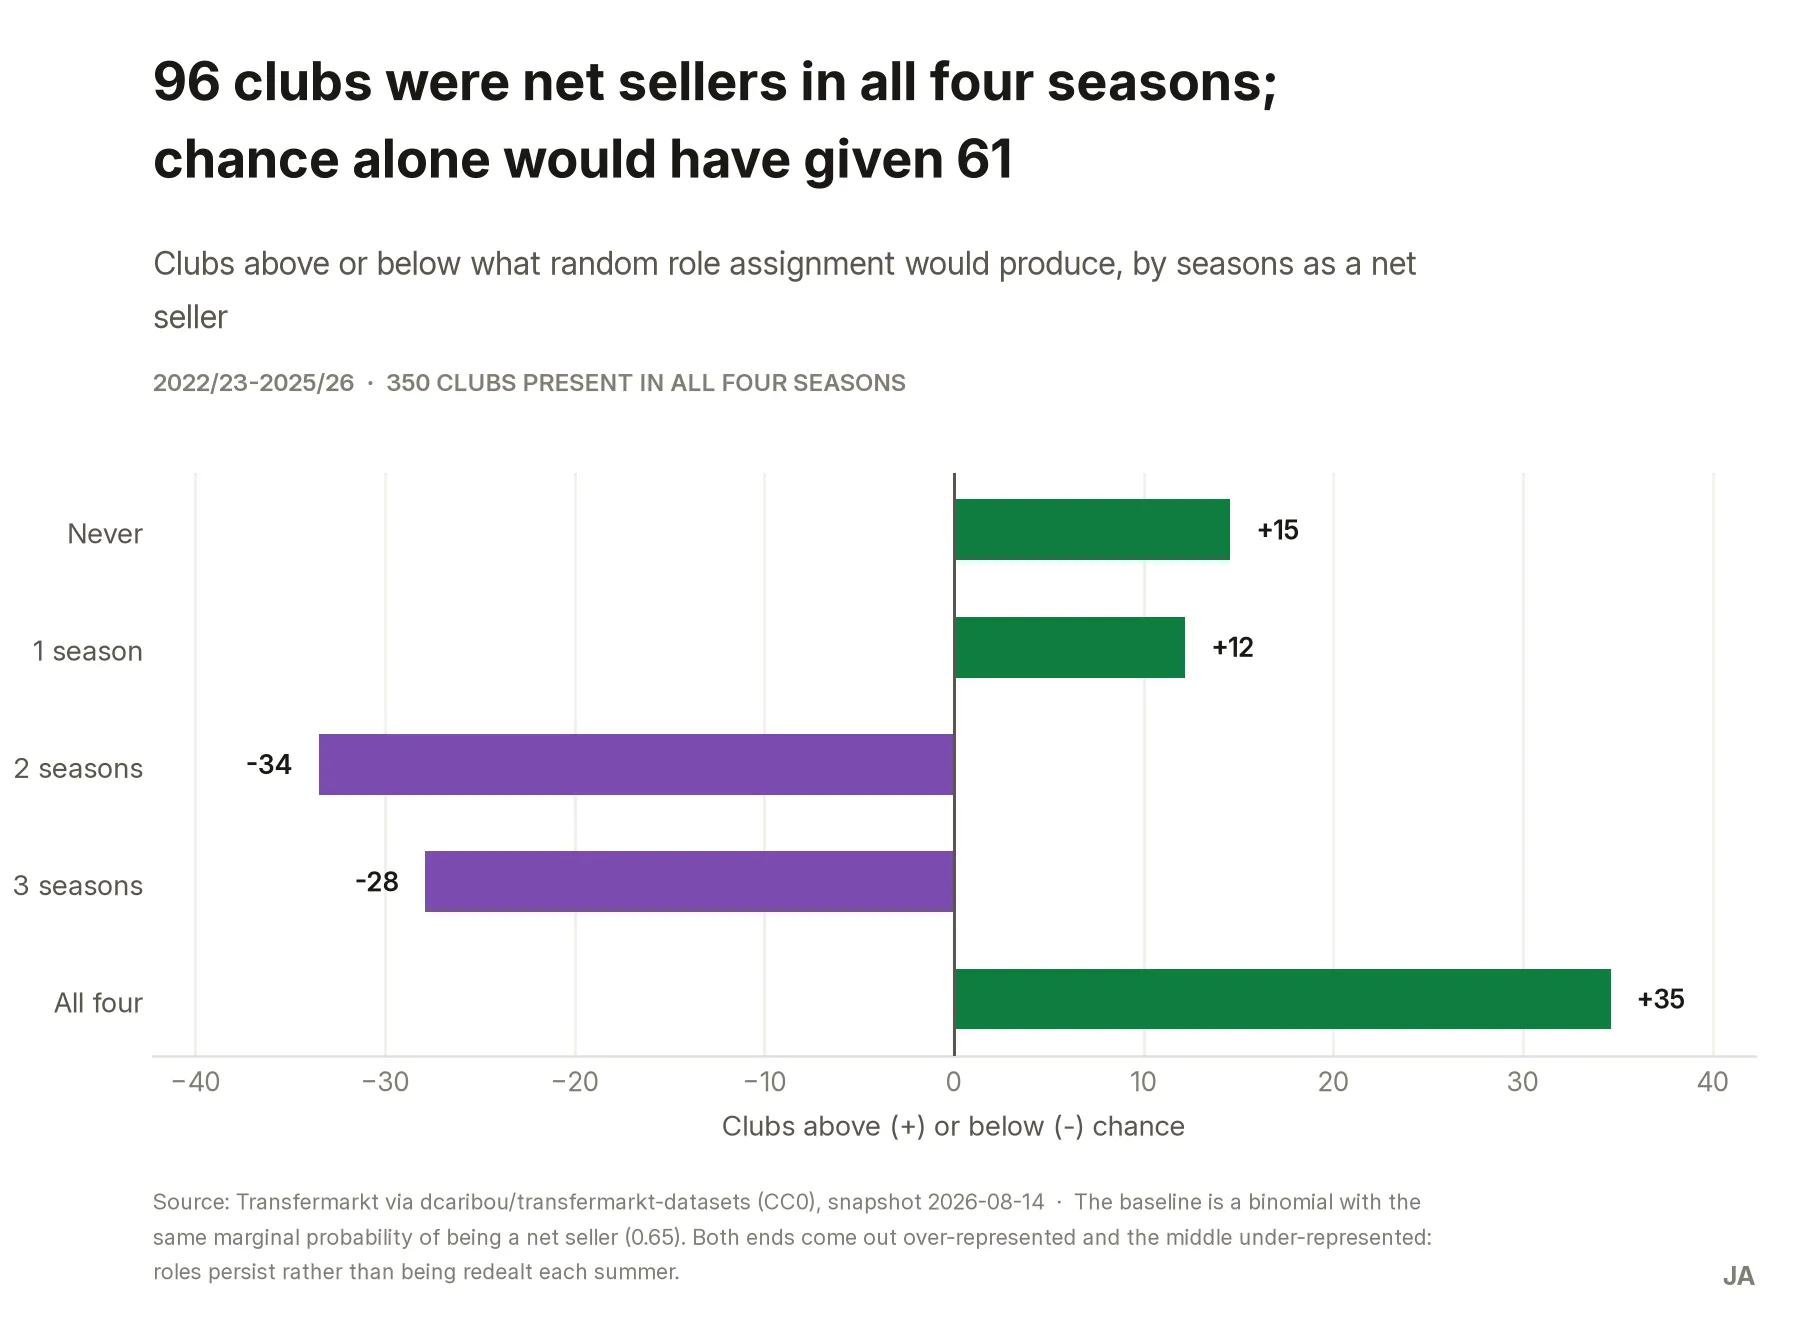
The industry treats both as settled: money pooling in fewer clubs, young players costing an ever-growing premium. Four transfer windows of deal-level data and a decade of FIFA's census contradict both. What is stable is who sells — 96 clubs were net sellers in all four seasons, where chance would have given 61.
Context
A multi-club investment fund has to decide where its next tranche of capital goes: into a club that develops and sells players, or into an elite one that buys them.
The answer turns on two beliefs the industry treats as settled, and between them they decide whether “develop and sell” still carries a margin:
- transfer spending is concentrating in fewer hands;
- young players now command a growing premium.
The analytical question: across the European transfer market, and over the four windows from 2022/23 to 2025/26, is spending concentrating on fewer buying clubs, and is a larger share of it going to players under 24?
I wrote the expected answer down before opening the data — the gap widening, the youth premium outgrowing the market — because a hypothesis recorded afterwards is not a hypothesis. The analysis contradicted it on both counts.
The client is fictional. The analysis is not.
Data
Two sources doing two different jobs, never joined at record level.
| Source | Job | Period | Licence |
|---|---|---|---|
| FIFA Global Transfer Report (FIFA TMS) | The decade series and the age axis | 2016–2025 market · 2018–2025 by age | FIFA publication; figures transcribed with citation, PDFs not redistributed |
dcaribou/transfermarkt-datasets |
Deal-level detail: clubs, players, fees | 22/23–25/26 | CC0-1.0 |
Each one covers the other’s blind spot:
- FIFA is a census. Every international transfer has to pass through the system that produces it, so it carries no survivorship bias — but it never names a club.
- Transfermarkt names everyone. That is what makes a buyer/seller gap computable at all — but it is a scrape, and its coverage is uneven.
The limitation that shaped the whole design. Transfermarkt rebuilds each player’s history from the players present in its base today. Coverage therefore thins going backwards — and, worse, it thins differentially by age. Between 2010/11 and 2025/26:
- the mean age of priced deals drifts from 20.8 to 24.4;
- the share of deals aged 18–21 falls from 53.8% to 21.2%.
None of that is football; it is who survives in the database. Taken at face value, this source answers the opposite of the hypothesis, for reasons that have nothing to do with the sport.
The series stabilises from 22/23 onwards, so deal-level analysis uses only those four seasons, and every claim about a decade comes from the census instead.
Four more limits, declared because they bound what can be said:
- No claim about the youth spending share, in level or direction. The two sources disagree, and the gap doubles in 2025 without an explanation I can defend.
- Under-18s are not analysable at 2–7 priced deals a season.
- Nothing here is causal. The case describes how the market is structured, not what moves it.
- Net transfer income is not profit. Without club accounts, “sells well” is not the same as “makes money”.
Process
SQL on DuckDB: four tables to join, a window to select, a categorisation to apply, and a rebuild
that needs no server and no cloud account. The queries live as real .sql files rather than inside
Python strings, so they can be read and judged on their own; Python only orchestrates them and
draws the figures.
Nothing in the raw data needed correcting. No duplicates, no impossible ages, no club transferring to itself, no club under two identifiers. Every transformation is a selection, not a repair — and the checks that came back empty are recorded anyway, because an unrecorded check is indistinguishable from a check never run.
Three decisions did have to be made:
- Only rows with a fee above zero carry price information. Upstream, the parser collapses loans, free transfers and unrecorded fees to zero or null without distinction, so a zero cannot be read as “moved for free”.
- Club coverage is partial and not at random, so the analysis runs on two declared universes: one for price and age metrics, which keeps the cheap purchases of young talent from outside the covered leagues; another for club-level metrics, where both parties have to be known.
- DuckDB compares strings case-sensitively. Unchecked, that would have silently emptied the European filter — no error, no warning, just an empty result that looks like an answer.
The pipeline reconciles its own row counts and fails loudly if the result stops matching what the previous phase closed with. A pipeline that finishes without complaining is not the same as a pipeline that is correct.
Findings
The money is spreading out, not concentrating
The ten largest buying clubs took 32.1% of European transfer spending in 2022/23 and 26.7% in 2025/26, while the number of clubs buying at all rose from 339 to 382.
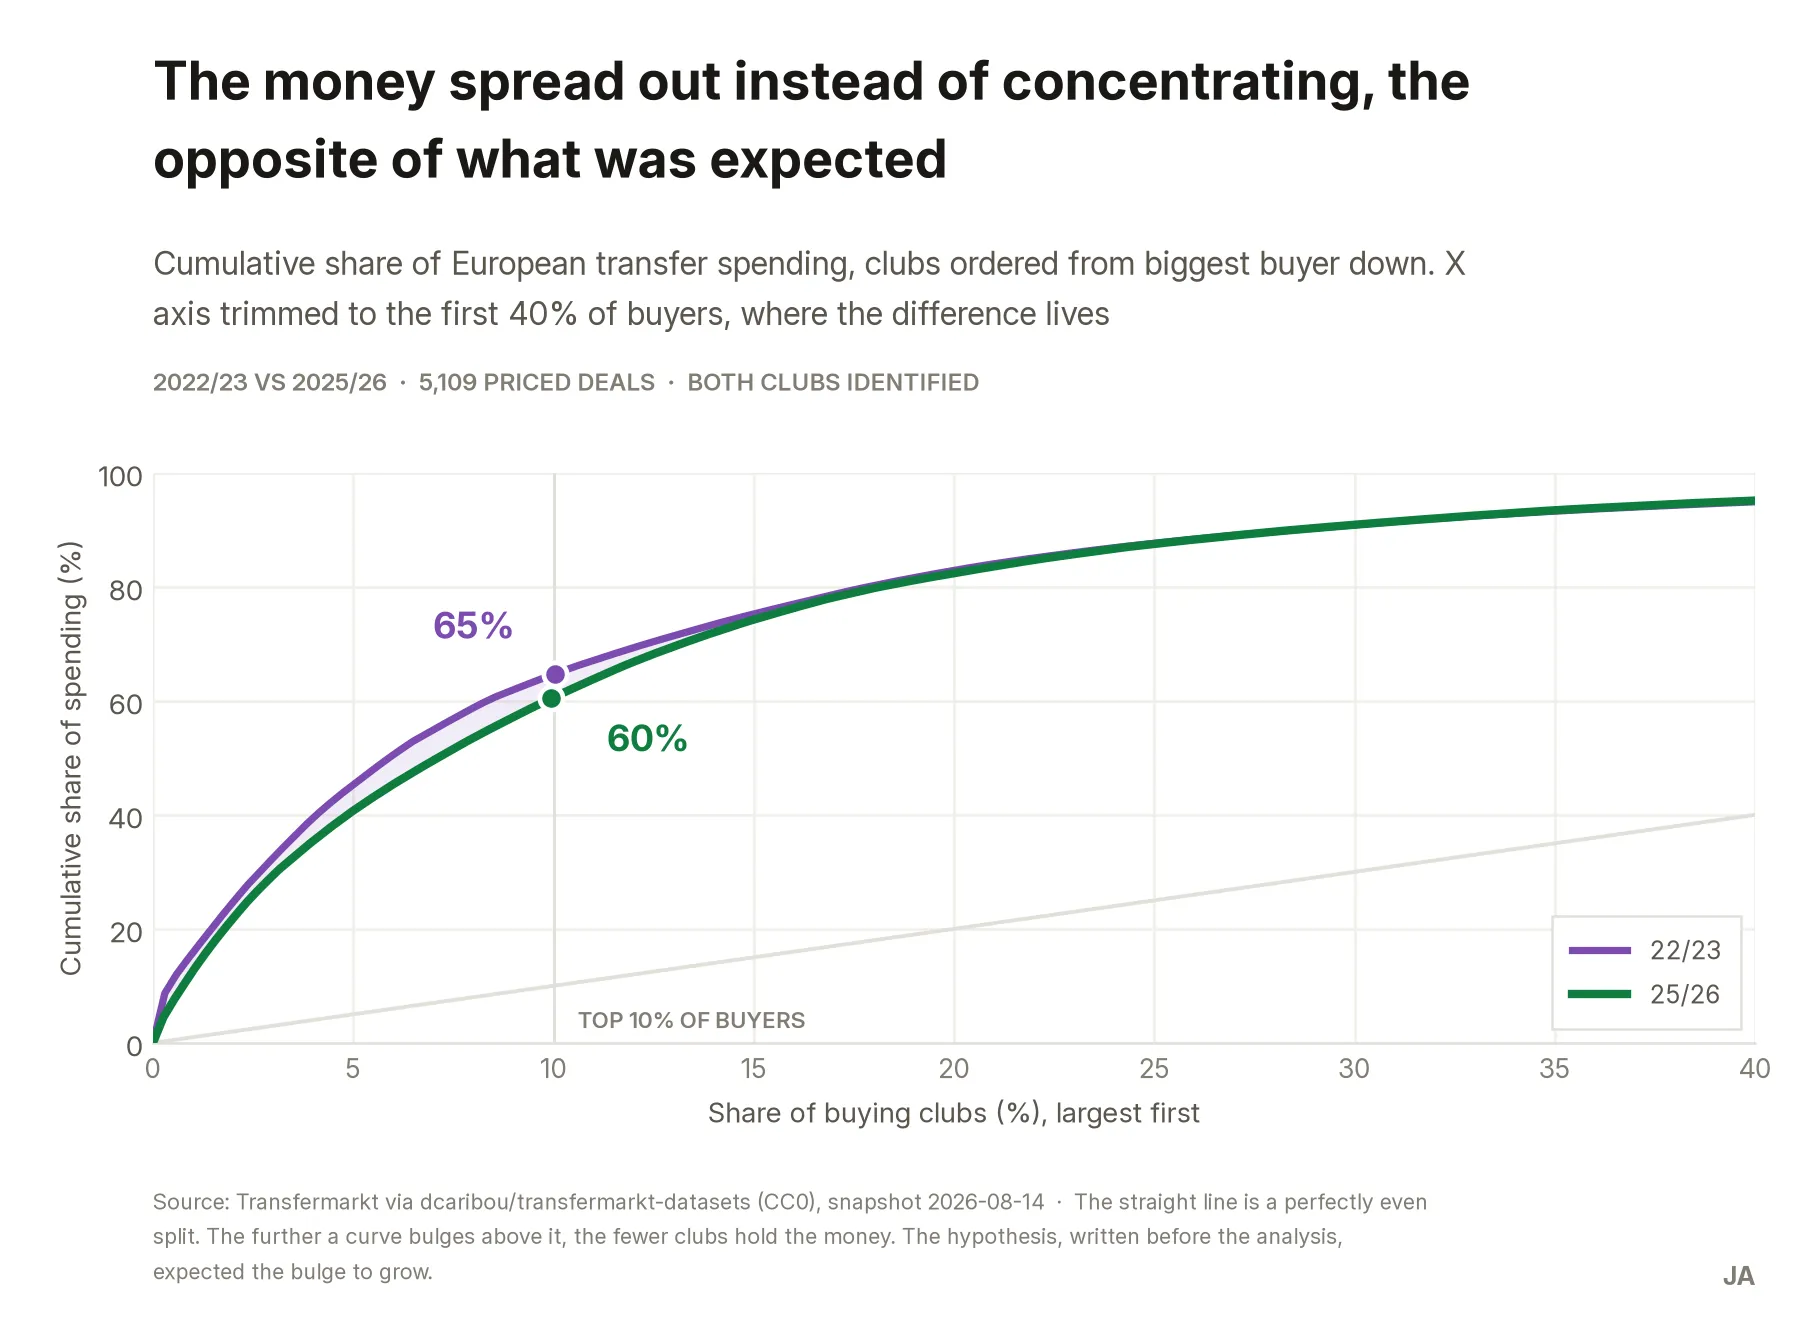
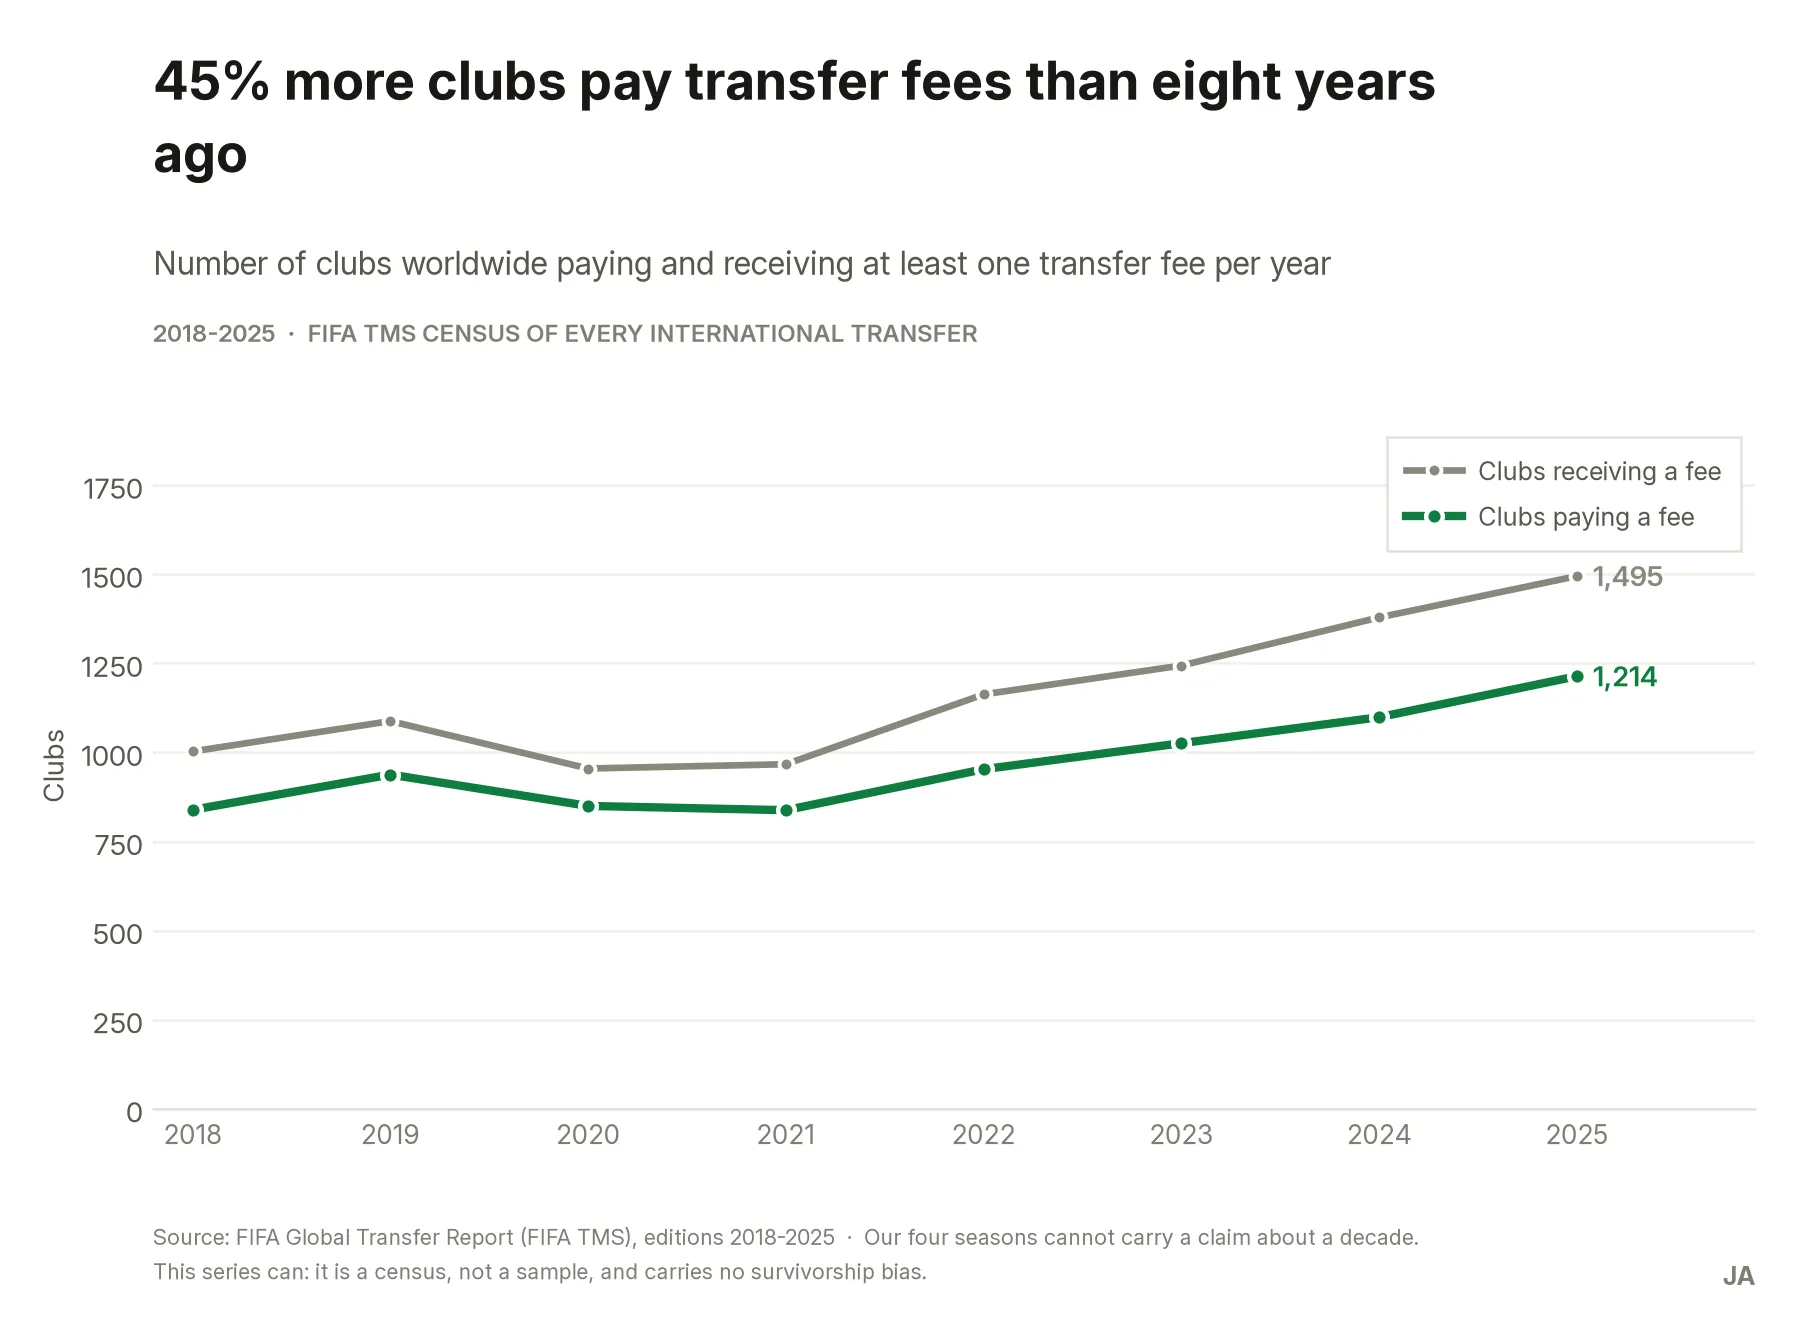
It is not an English phenomenon: excluding English buyers the top-10 share still falls, from 30.6% to 24.0%. And it is not a four-season blip — FIFA’s census shows 45% more clubs paying transfer fees in 2025 than in 2018, and 49% more receiving them.
Selling is a position, not a bad year
Of the 350 clubs present in all four seasons, 202 were net sellers in three or more, and 96 in all four. If the role were dealt at random with the same overall frequency, 61 clubs would land in that last group — and 5 would never sell, against the 20 observed. Both tails are over-represented, so the roles persist rather than rotating each summer.
The measure names them:
- Always selling — Ajax banked €267m net across the four seasons, Salzburg €234m, Lille €185m.
- Never selling — Chelsea (−€800m), Manchester United (−€672m) and Arsenal (−€637m) did not finish a single season as net sellers.
Youth carries no premium
An 18–23 player costs about what a 24–29 player costs, and that ratio does not escalate in either source over the period measured.
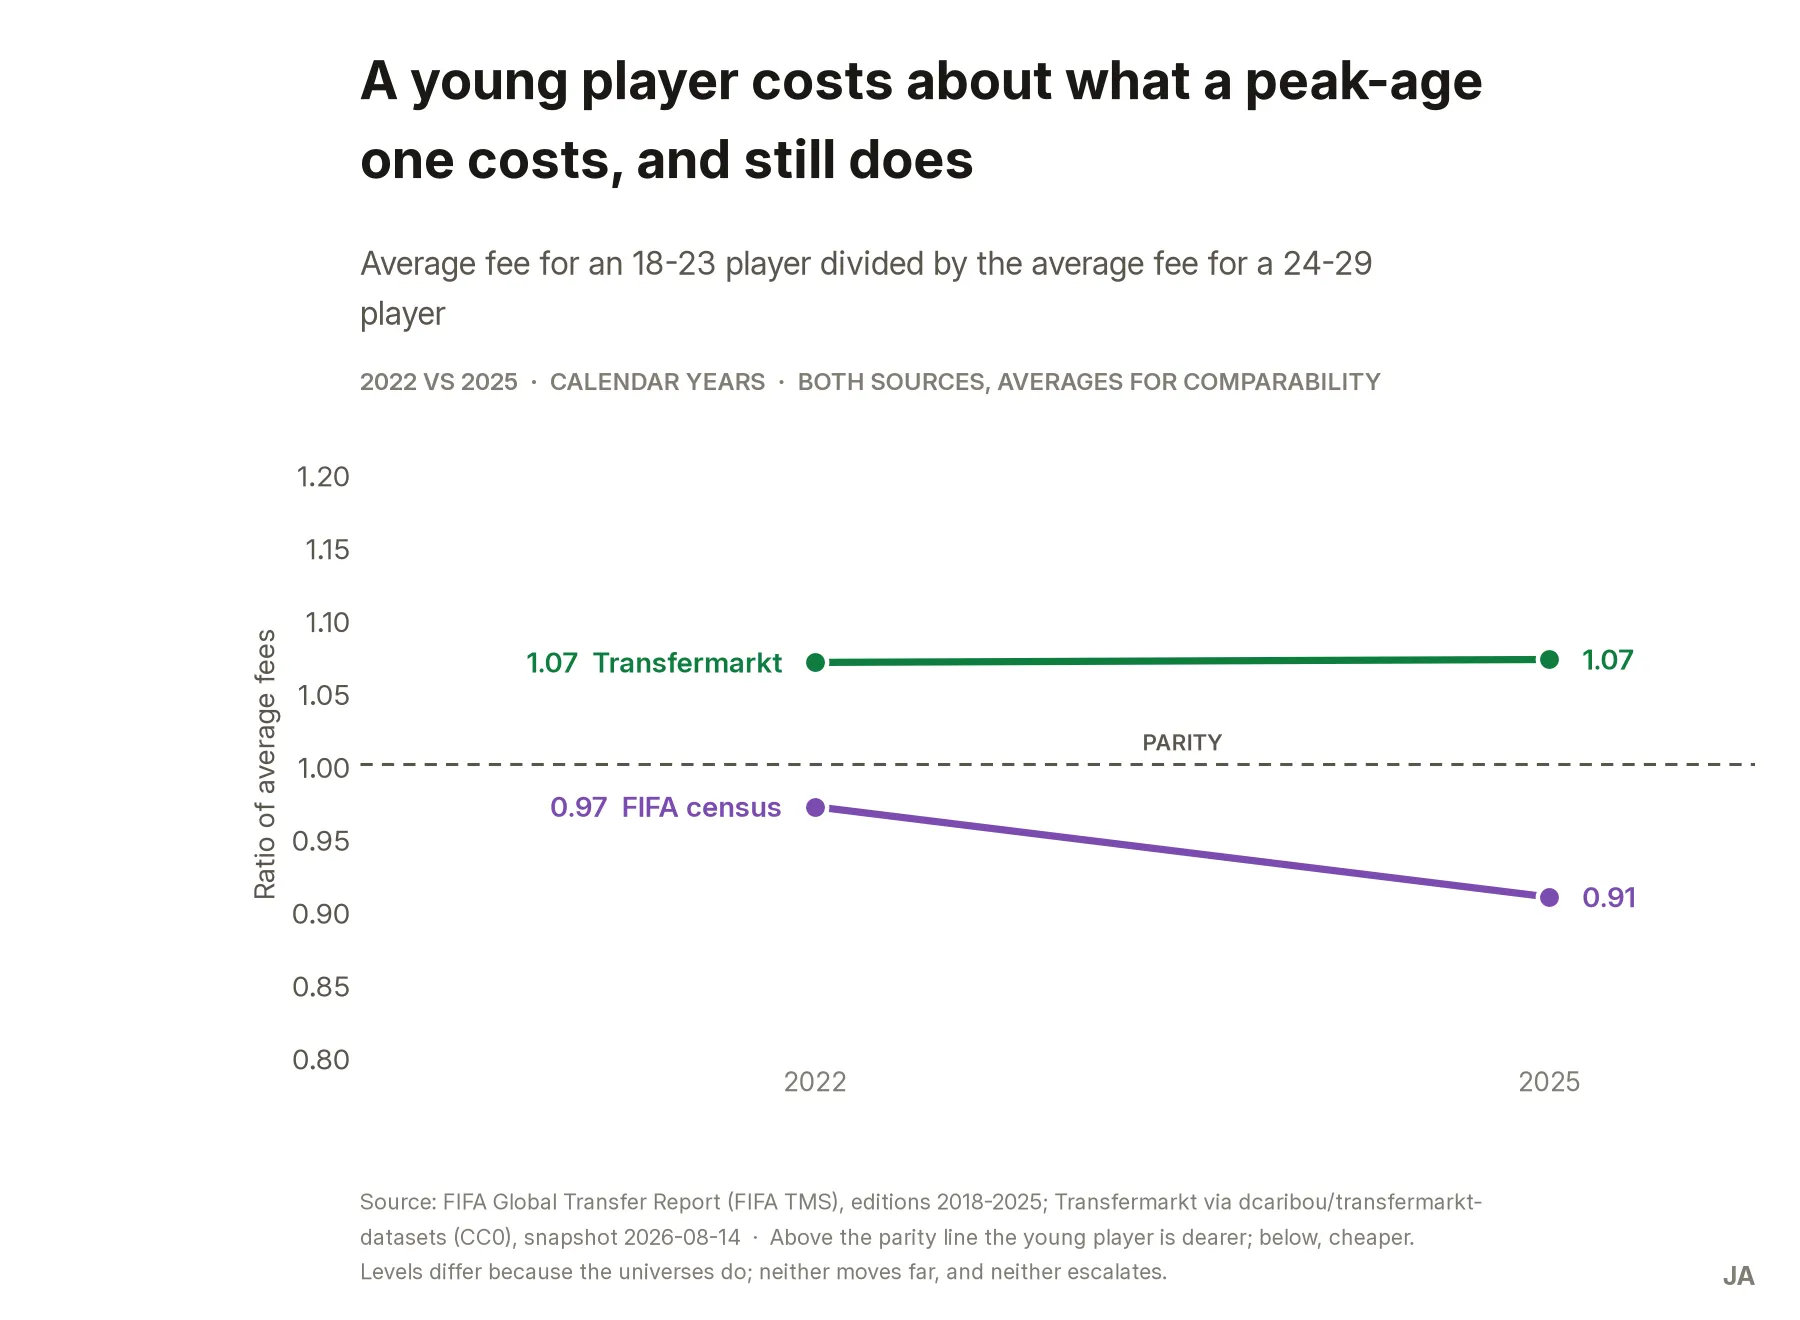
The levels differ because the universes do — FIFA counts only international transfers, this dataset also counts domestic ones — but neither series rises.
An earlier reading of mine said the ratio was falling. It appeared only when cutting the data by season, and hung on a single starting observation, so it did not survive checking against other specifications and was withdrawn. What the evidence carries is parity and no escalation, and that is what is published.
But the young market runs at two speeds
Inside the 18–23 bracket, deals of €40m or more are 2.3% of transactions and take 23.8% of everything spent on the bracket, while the 71% priced under €5m account for 15%.
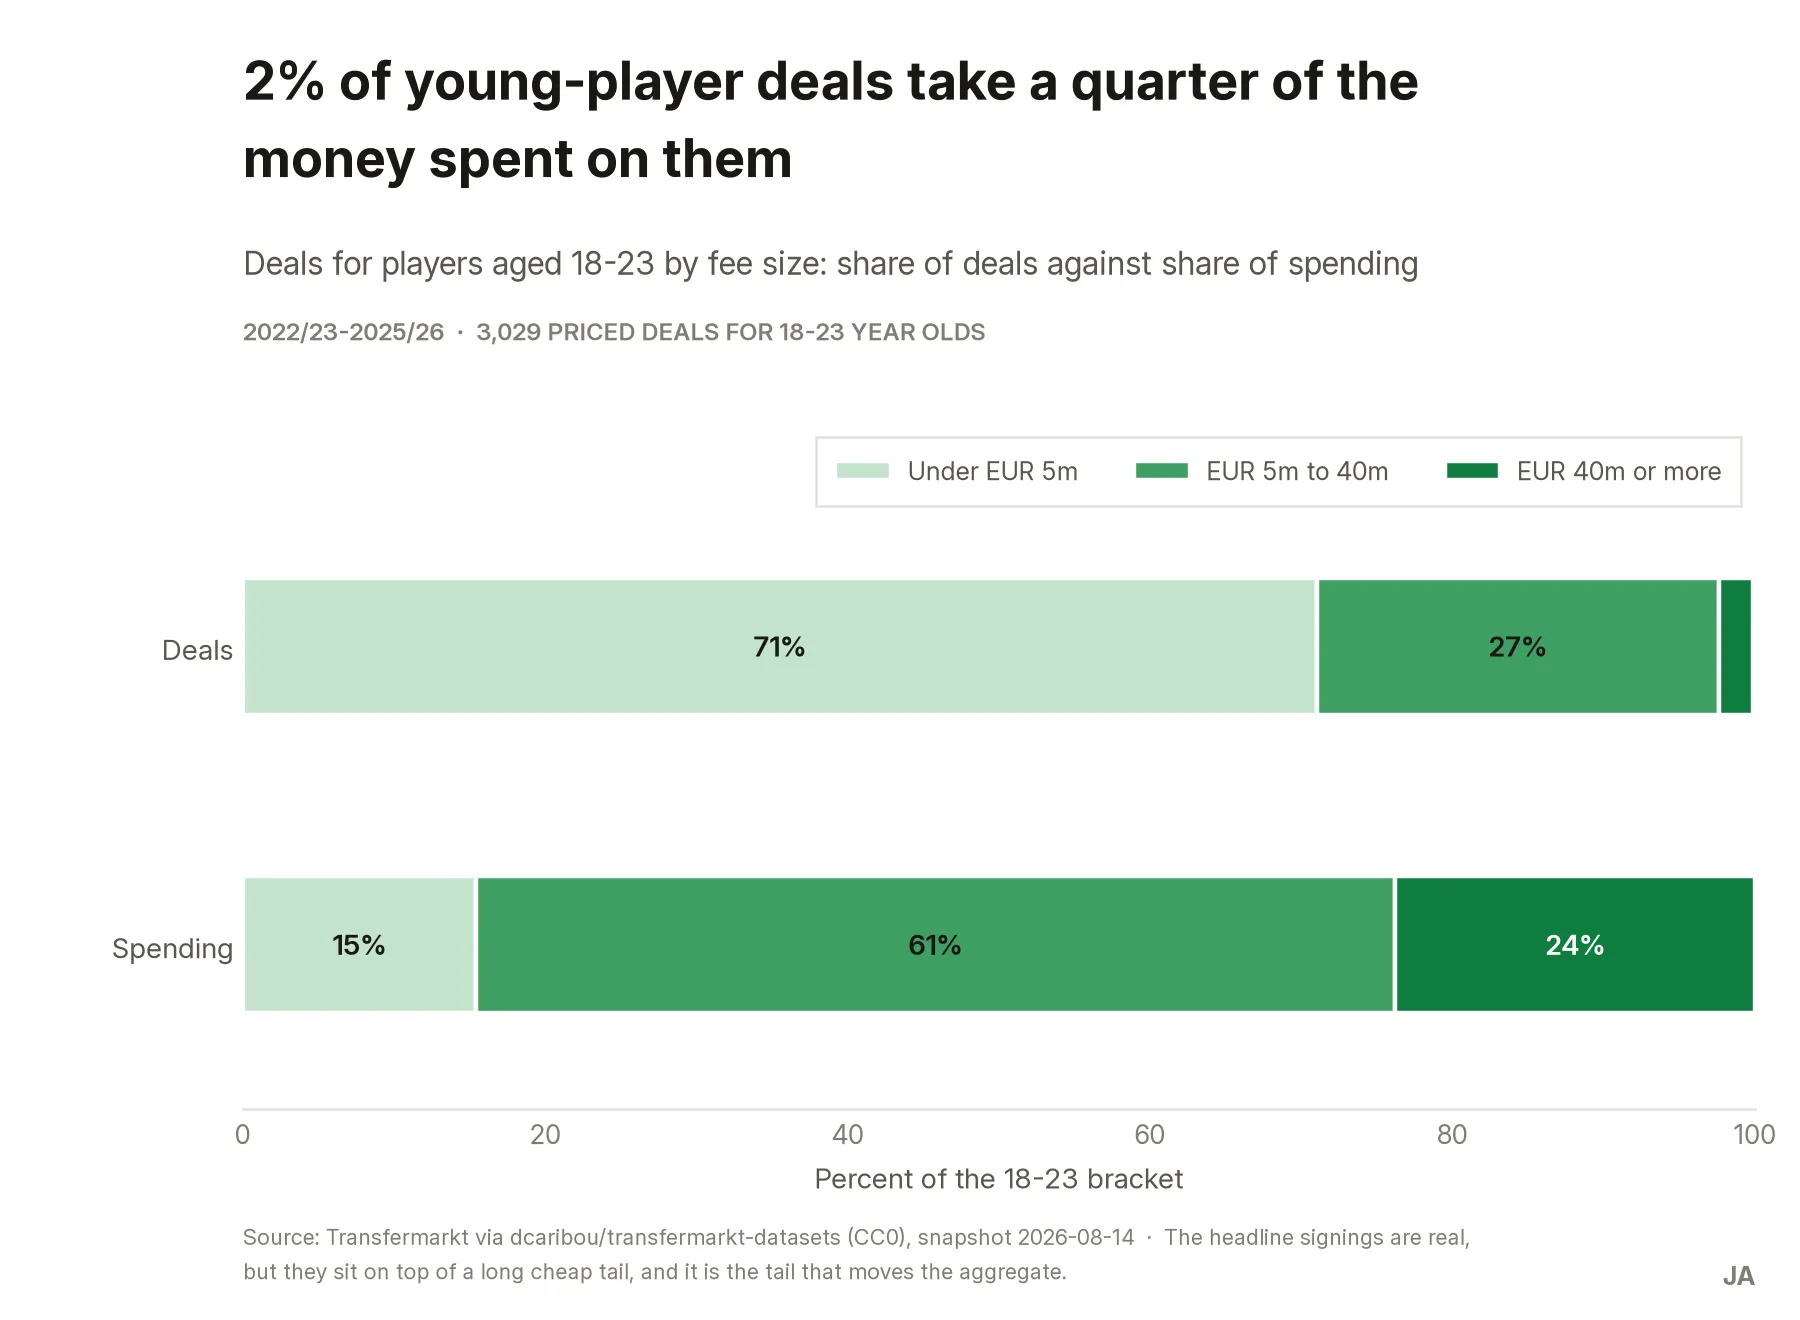
The headline signings are real and concentrated — Chelsea alone spent €688m across ten such deals, Liverpool €462m, PSG €430m, and seven of the top ten buyers are English — but they sit on top of a long, cheap tail, and it is the tail that moves the aggregate.
Recommendations
Three actions, ranked by impact against effort:
- Put the next tranche into a persistent net seller in a mid-tier league, not an elite club. The scarce asset is not money to spend — that side of the market gains participants every year — but a reliable supply of sellable players. Measured by the invested club’s net transfer balance over three seasons. Risk: net transfer income is not profit, and without club accounts a good seller can still be a bad business.
- Cap purchase prices against the market band for the role, and write into the mandate that age carries no premium. A policy line rather than a project, and the cheapest of the three to adopt. Risk: it needs a documented-exception route, or it will be ignored the first time a sporting director wants a particular player.
- Make each club pick its lane in the young-player market — cheap volume or elite few — and size its scouting for that one. A club drifting between the two competes badly in both.
Deliberately not a recommendation. Saudi clubs went from €9m to €565m in four seasons, which may be opening an exit for players over 28. It is a real finding, but four seasons cannot separate a structural change from a spending cycle — and recommending a strategy on that basis is exactly what this case spent six phases refusing to do.
Reproduce
# 1. Clone
git clone https://github.com/BobbyTarantino099/football-transfer-market.git
cd football-transfer-market

# 2. Dependencies
pip install -r requirements.txt

# 3. No download needed. The upstream dataset refreshes weekly, so the snapshot used by
#    the analysis is frozen in datos/crudos/, with the SHA-256 of each file recorded in
#    documentacion/fichas-de-fuente.md. To rebuild it against today's data:
#      python notebooks/descargar.py     # the numbers will move; that is expected

# 4. Run in order — each step consumes the previous one's output
python notebooks/procesar.py    # runs consultas/01 and 02 -> datos/limpios/*.duckdb
python notebooks/analizar.py    # runs consultas/03 to 06  -> salidas/tablas/
python notebooks/verificar.py   # the analysis checks
python notebooks/graficos.py    # the figures -> salidas/graficos/
python notebooks/build_docx.py  # the executive summary
The full phase-by-phase log, the cleaning log with every discarded alternative, the ROCCC source records and the ten verification blocks live in the repository.
What this demonstrates
The part I most want to show is the one a portfolio rarely has: a hypothesis written down before the analysis, and published unchanged when the data contradicted it — on both axes at once. A conclusion that could have gone the other way and did not get forced is worth more than a tidy one.
Underneath that, the reason the answer is trustworthy at all is a data-quality decision made in phase 2 rather than discovered in phase 5. The obvious dataset for this question rebuilds its history from surviving players, so its coverage thins backwards and by age — precisely the axis under study. Reconciling it against FIFA’s official census is what caught it, and it is why the decade claims and the deal-level claims come from different sources on purpose.
It also puts SQL at the centre: the whole analysis is .sql files on DuckDB, readable without
running anything, with Python confined to orchestration and figures.