Private credit / small-business lending
Corrected for age, the 2023 vintage of US small-business loans is the worst since 2009
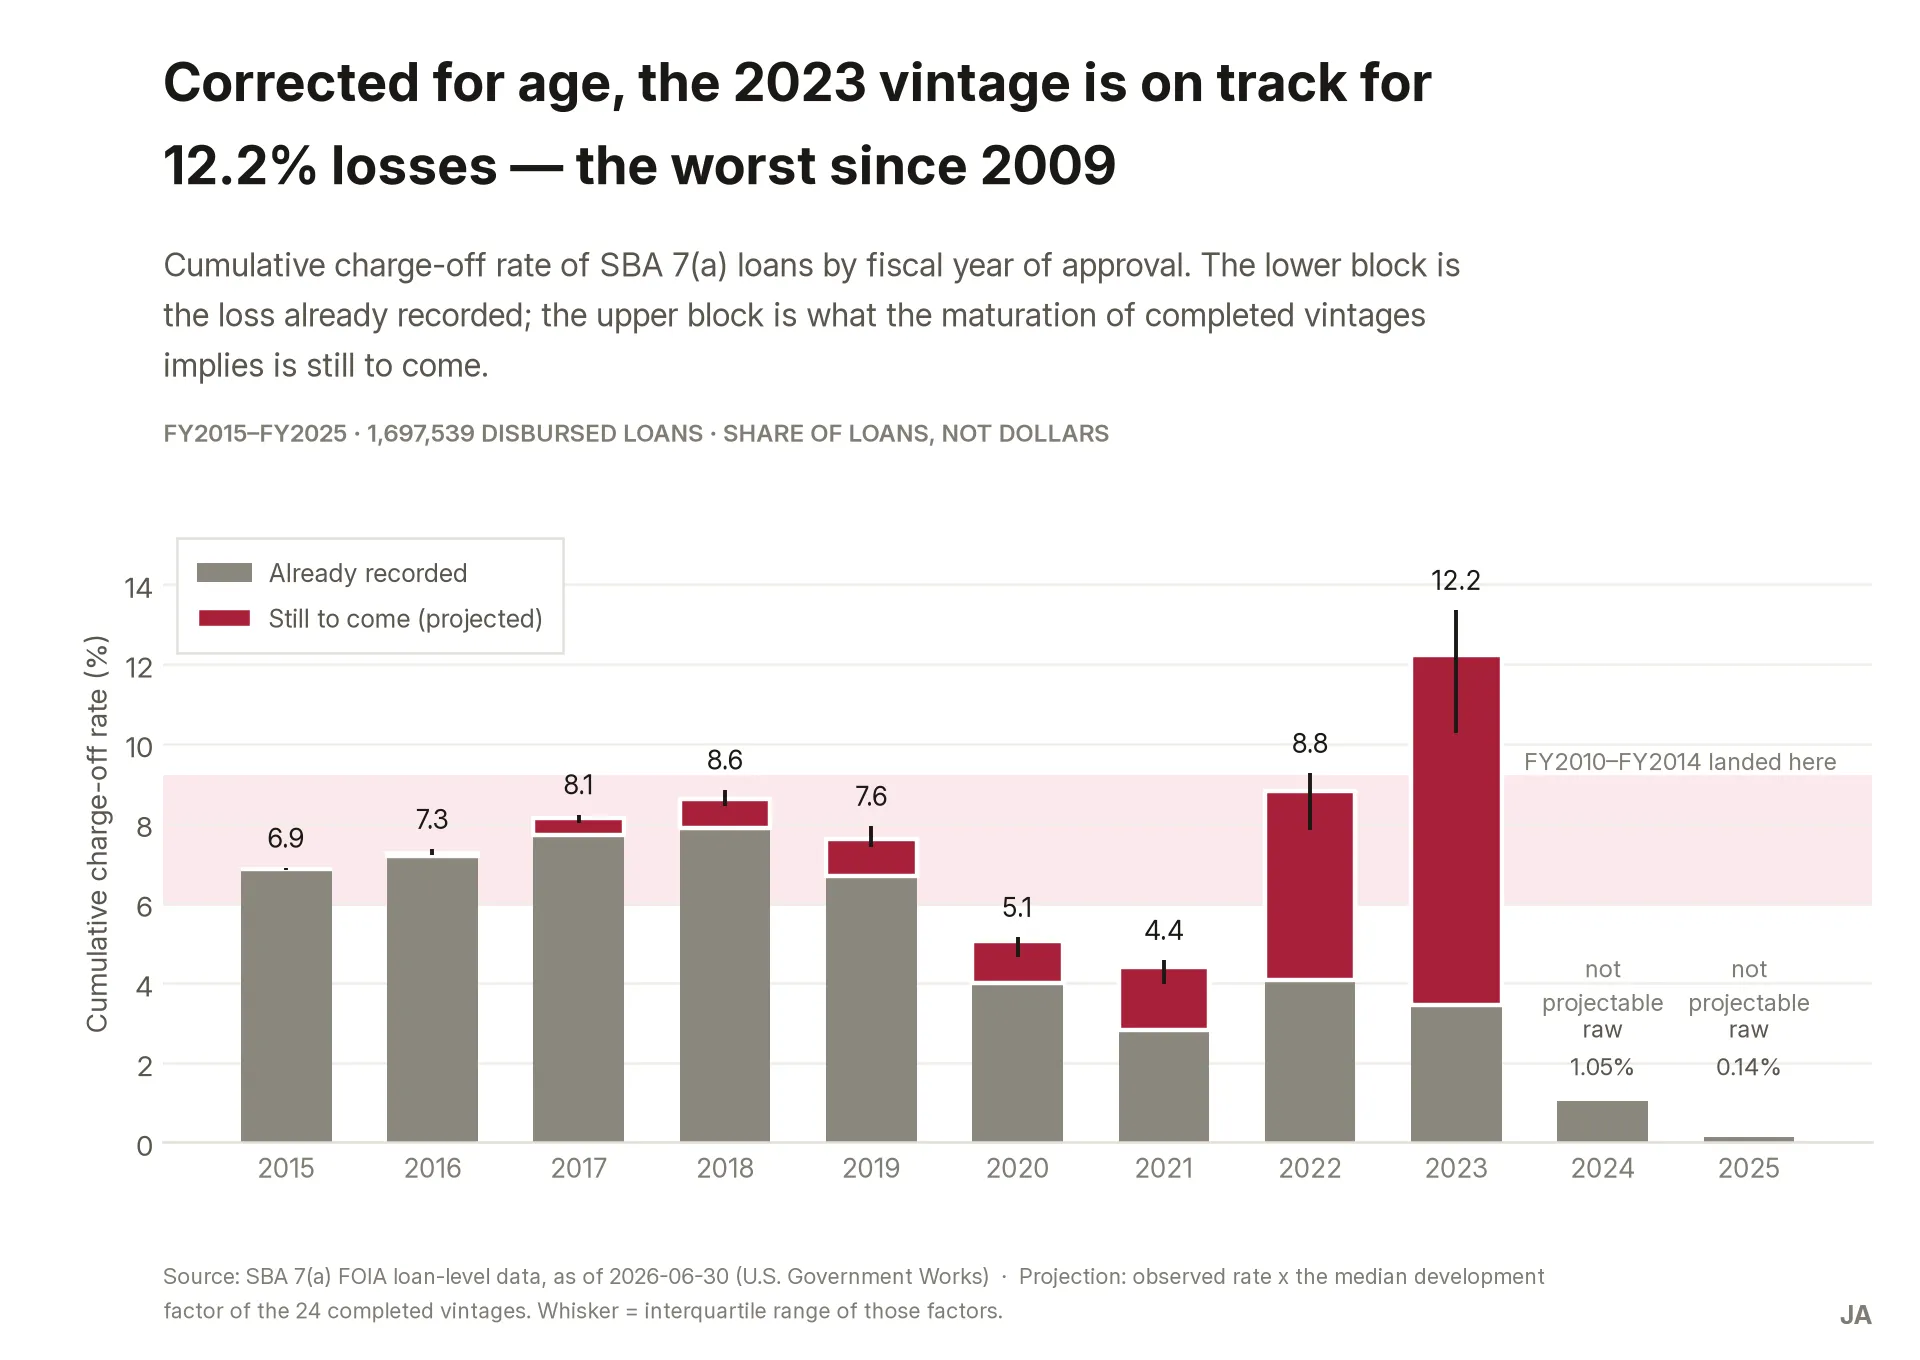
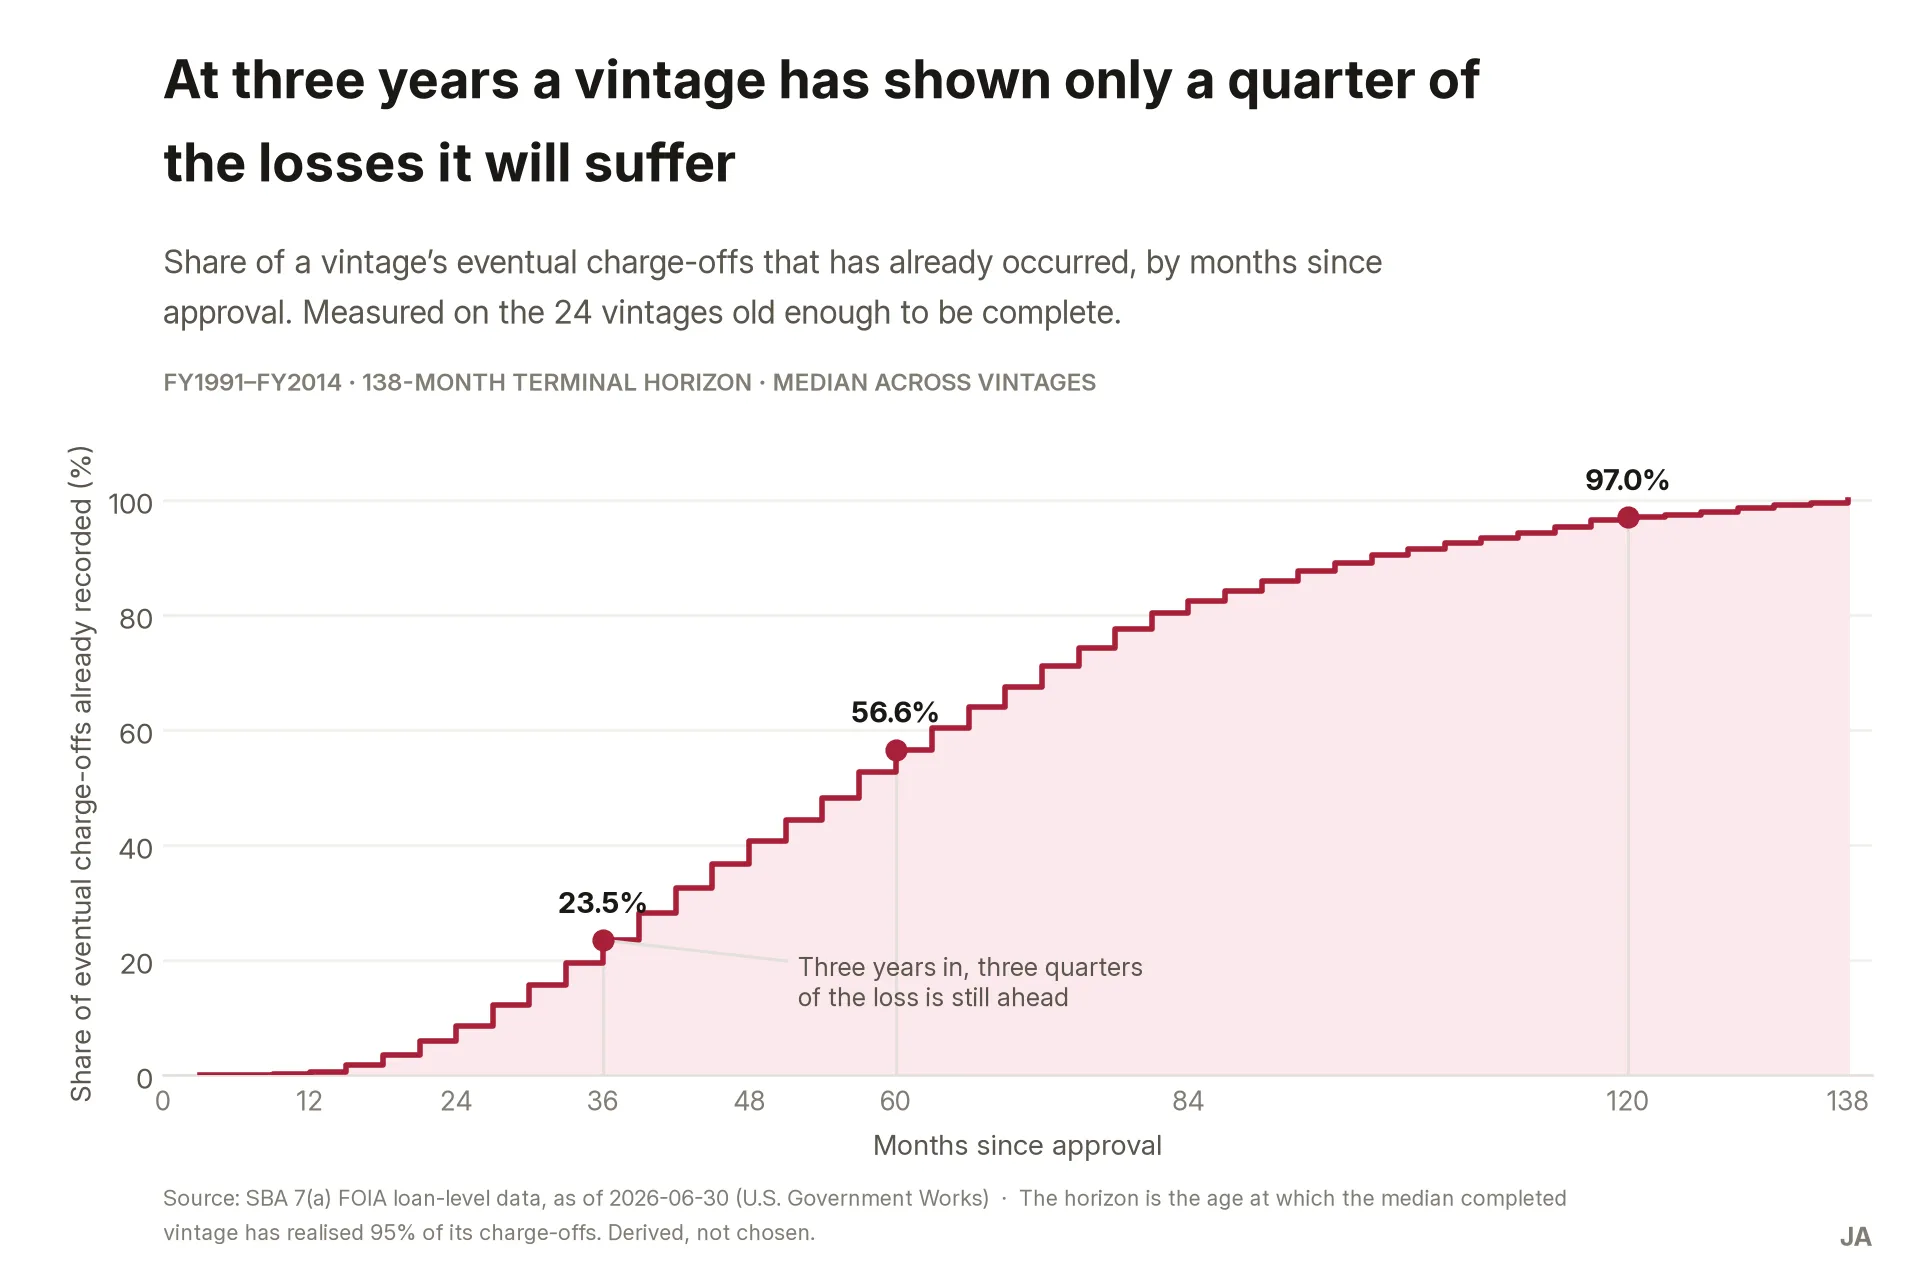
A loan book's charge-off rate lies when the vintages inside it are of different ages. The 2023 SBA vintage shows 3.5%, one of the best numbers in the programme's history; read at the same age as every other vintage it projects to 12.2%. At 36 months a vintage has realised only 23.5% of the losses it will suffer.
Context
A private credit fund has to commit an expected-loss assumption for a book of US small-business loans now. The only evidence available to it is the charge-off rate of recent origination years — and that evidence is flattering by construction, because a loan approved eighteen months ago has not had time to default.
The analytical question I framed: across SBA 7(a) loans approved between 1991 and 2026, how does the cumulative charge-off rate evolve with months elapsed since approval for each annual vintage — and once vintages are read at equal age rather than at a common date, what terminal loss do the immature ones imply? The decision this unlocks is specific: the loss figure that goes into the underwriting model, and the origination mix the fund declines to buy.
Client is fictional; the analysis is not.
Data
| Source | Job in the case | Period · volume | Licence |
|---|---|---|---|
| SBA 7(a) FOIA loan-level extract | The whole analysis | 1991–2026, as of 30 June 2026 · 1,961,455 approvals · 901 MB | U.S. Government Works |
| SBA quarterly performance report | Reconciliation only — never enters the analysis | 2016–2025 · 30 figures transcribed | U.S. Government Works |
The single most consequential field is LoanStatus, and specifically its value EXEMPT. The
publisher defines it as a loan disbursed but not cancelled, paid in full or charged off —
withheld from disclosure, but alive. That is not missing data: it is the censoring indicator,
handed over explicitly. Its share climbs from 0.7% of the 1991 vintage to 76.8% of 2024, exactly as
that definition predicts.
An analyst who drops those 297,494 loans as “unknown outcome” deletes almost the entire recent population and concludes that new vintages barely default. An analyst who keeps them without adjusting for age concludes the same thing for the opposite reason. Both are the error this case exists to correct.
What the data cannot answer. A net loss figure: the extract records no recoveries, so every rate here is gross — SBA’s published recovery tables bound the overstatement at roughly a third, but they are measured against a different amount and on a different year axis, so no conversion is attempted. The level of loss in unguaranteed private credit: these loans carry a partial government guarantee, and while the shape of the maturation curve transfers, the level does not. Sector before 2001, which the file simply does not record. And why any vintage behaved as it did — no causal claim is made anywhere in this case.
Process
SQL on DuckDB, with Python confined to orchestration and figures. The whole analysis is five .sql
files that can be read without running anything.
The population is the disbursed loans — paid in full, charged off, or still alive — which is 1,697,539 of the 1,961,455 approvals. Cancelled and undisbursed loans never put money at risk, so they belong in neither numerator nor denominator. That reconciliation is asserted in code: the pipeline stops if it stops balancing.
Two decisions in the cleaning are worth naming, because they could each have gone the other way. 32 loans carry a charge-off date later than the file’s own cut-off — the file contradicts itself. They keep their loan and lose their date, counting in the terminal rate but not on the curve; clamping the dates to the cut-off would have invented an age nobody observed and piled them into a single month at the far right of the chart, which is exactly where the case makes its claim. And duplicates are not removed: the file has no loan number, and of the repeated borrower-date-amount-bank keys, most differ in term or in outcome, so they are distinct loans.
The population reconciles against SBA’s own performance reporting — a different pipeline from the disclosure extract — to within four loans across nine fiscal years of 42,000 to 70,000 each. Amounts run 0.7–1.7% low in every single year, which the report’s own definition explains: it counts loan increases made after approval, and the extract carries only the original. A small deviation with a constant sign and a documented cause is better evidence than a smaller one that wanders.
Findings
At three years, a vintage has shown only a quarter of what it will cost. Across the 24 vintages old enough to have finished, 23.5% of eventual charge-offs have occurred by month 36. The median default arrives at month 58 — year five, not year three. Half the loss is still ahead at the five-year mark, which is why the terminal horizon had to be set at 138 months rather than the 84 or 120 I expected.
The 2023 vintage projects to 12.2% against an observed 3.5%. Every completed vintage from 2010 to 2014 landed between 6.0% and 9.2%; the 2023 projection exceeds all of them, and so does the bottom of its band. In dollar terms — cents charged off per dollar approved — it moves from 0.75 to 4.24, which would make it the worst vintage since 2010 on that measure.
And two vintages get no number at all. The 2024 and 2025 books have realised 5.9% and 0.2% of their eventual loss, which makes their development factors 17× and 606×. Multiplying a near-zero rate by 606 produces a confident-looking figure resting on nothing — the same error this case exists to expose, committed in its own final chart. The honest output is the gap, and it is drawn as a gap.
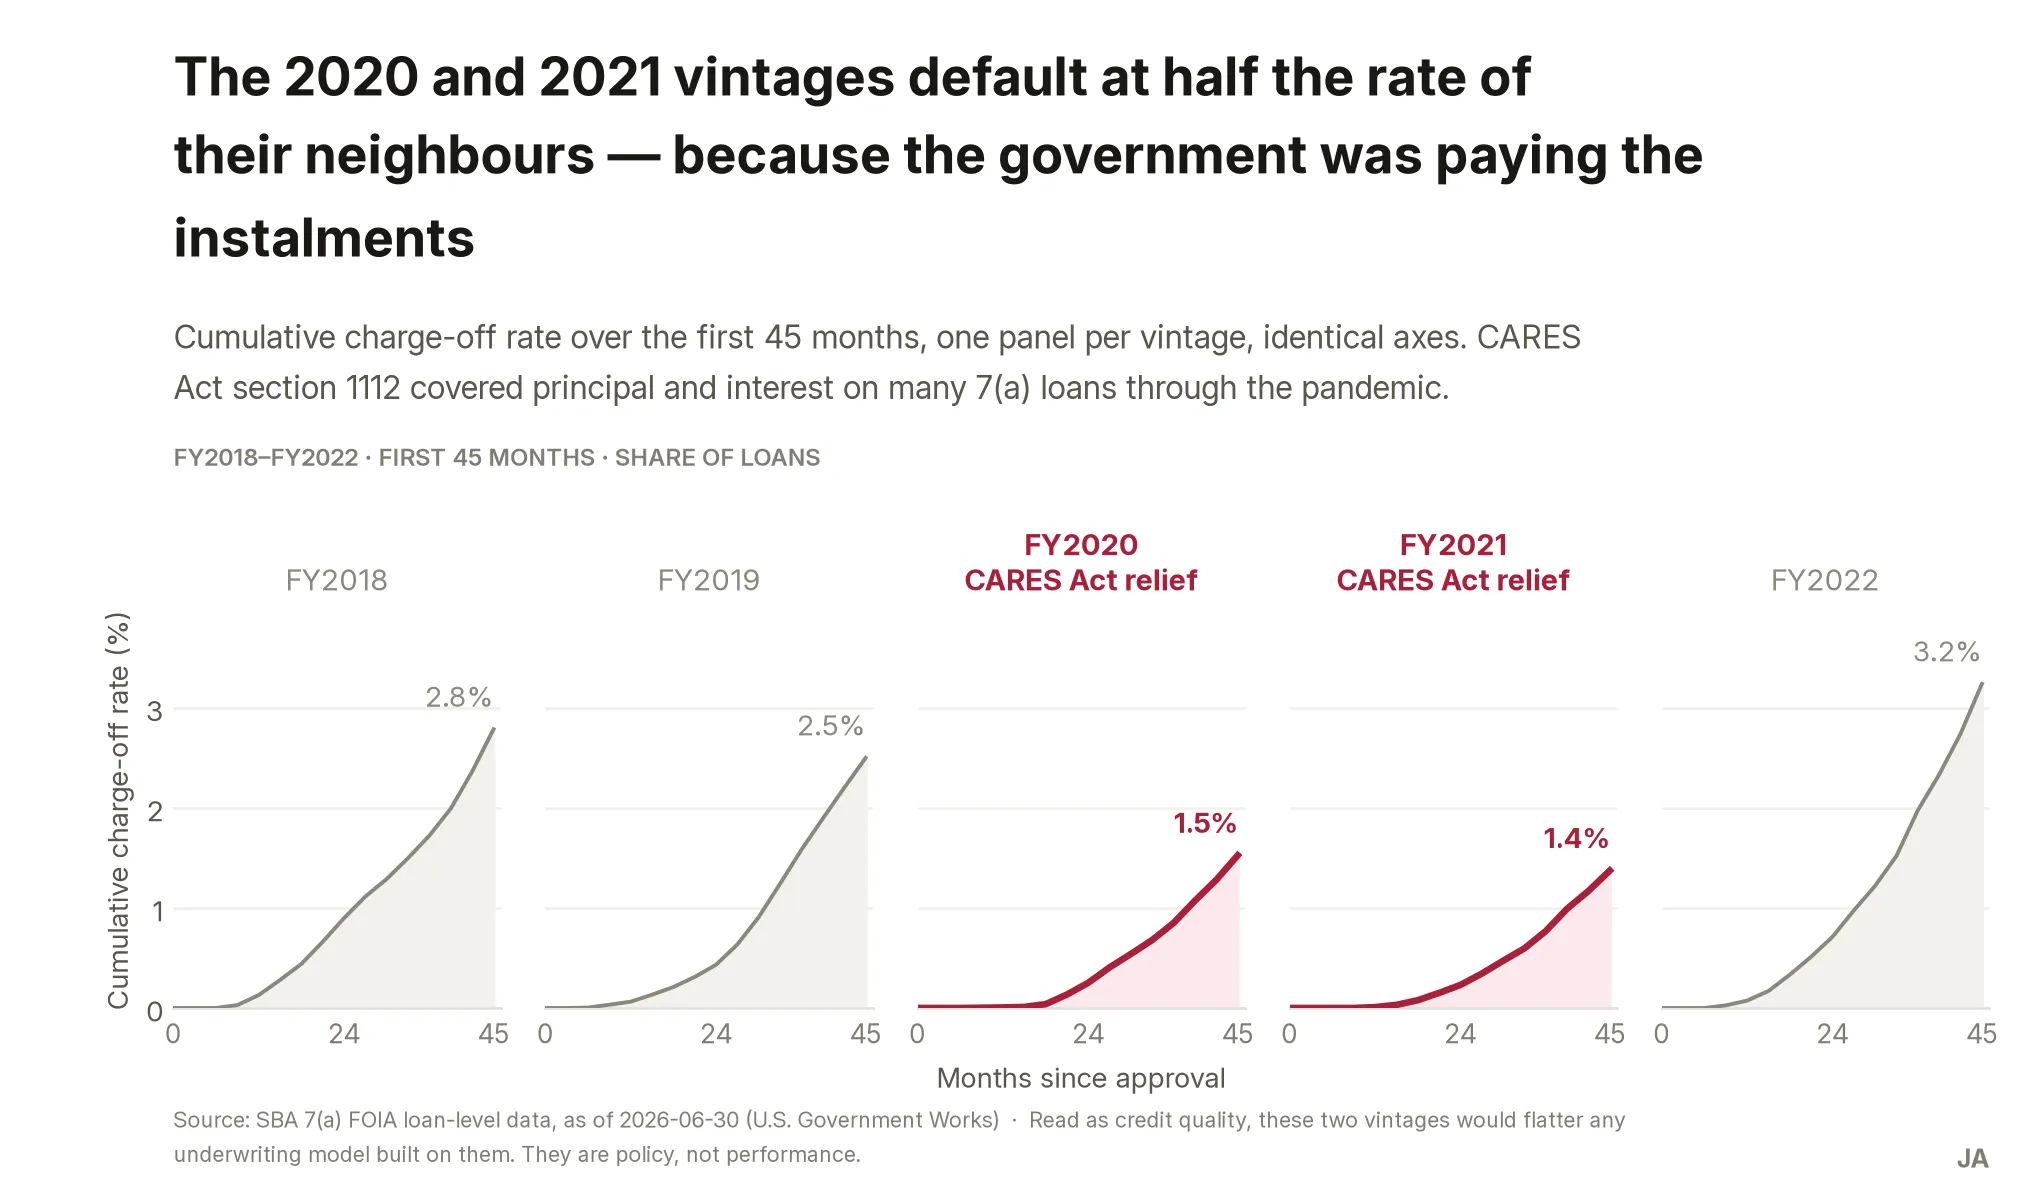
The 2020 and 2021 vintages are policy, not performance. At the same age they default at roughly half the rate of every neighbour — 0.85% and 0.77% against 1.58% to 1.98%. Under CARES Act section 1112 the federal government was paying principal and interest on many of these loans. A model calibrated on those two years understates everything else by about 18%.
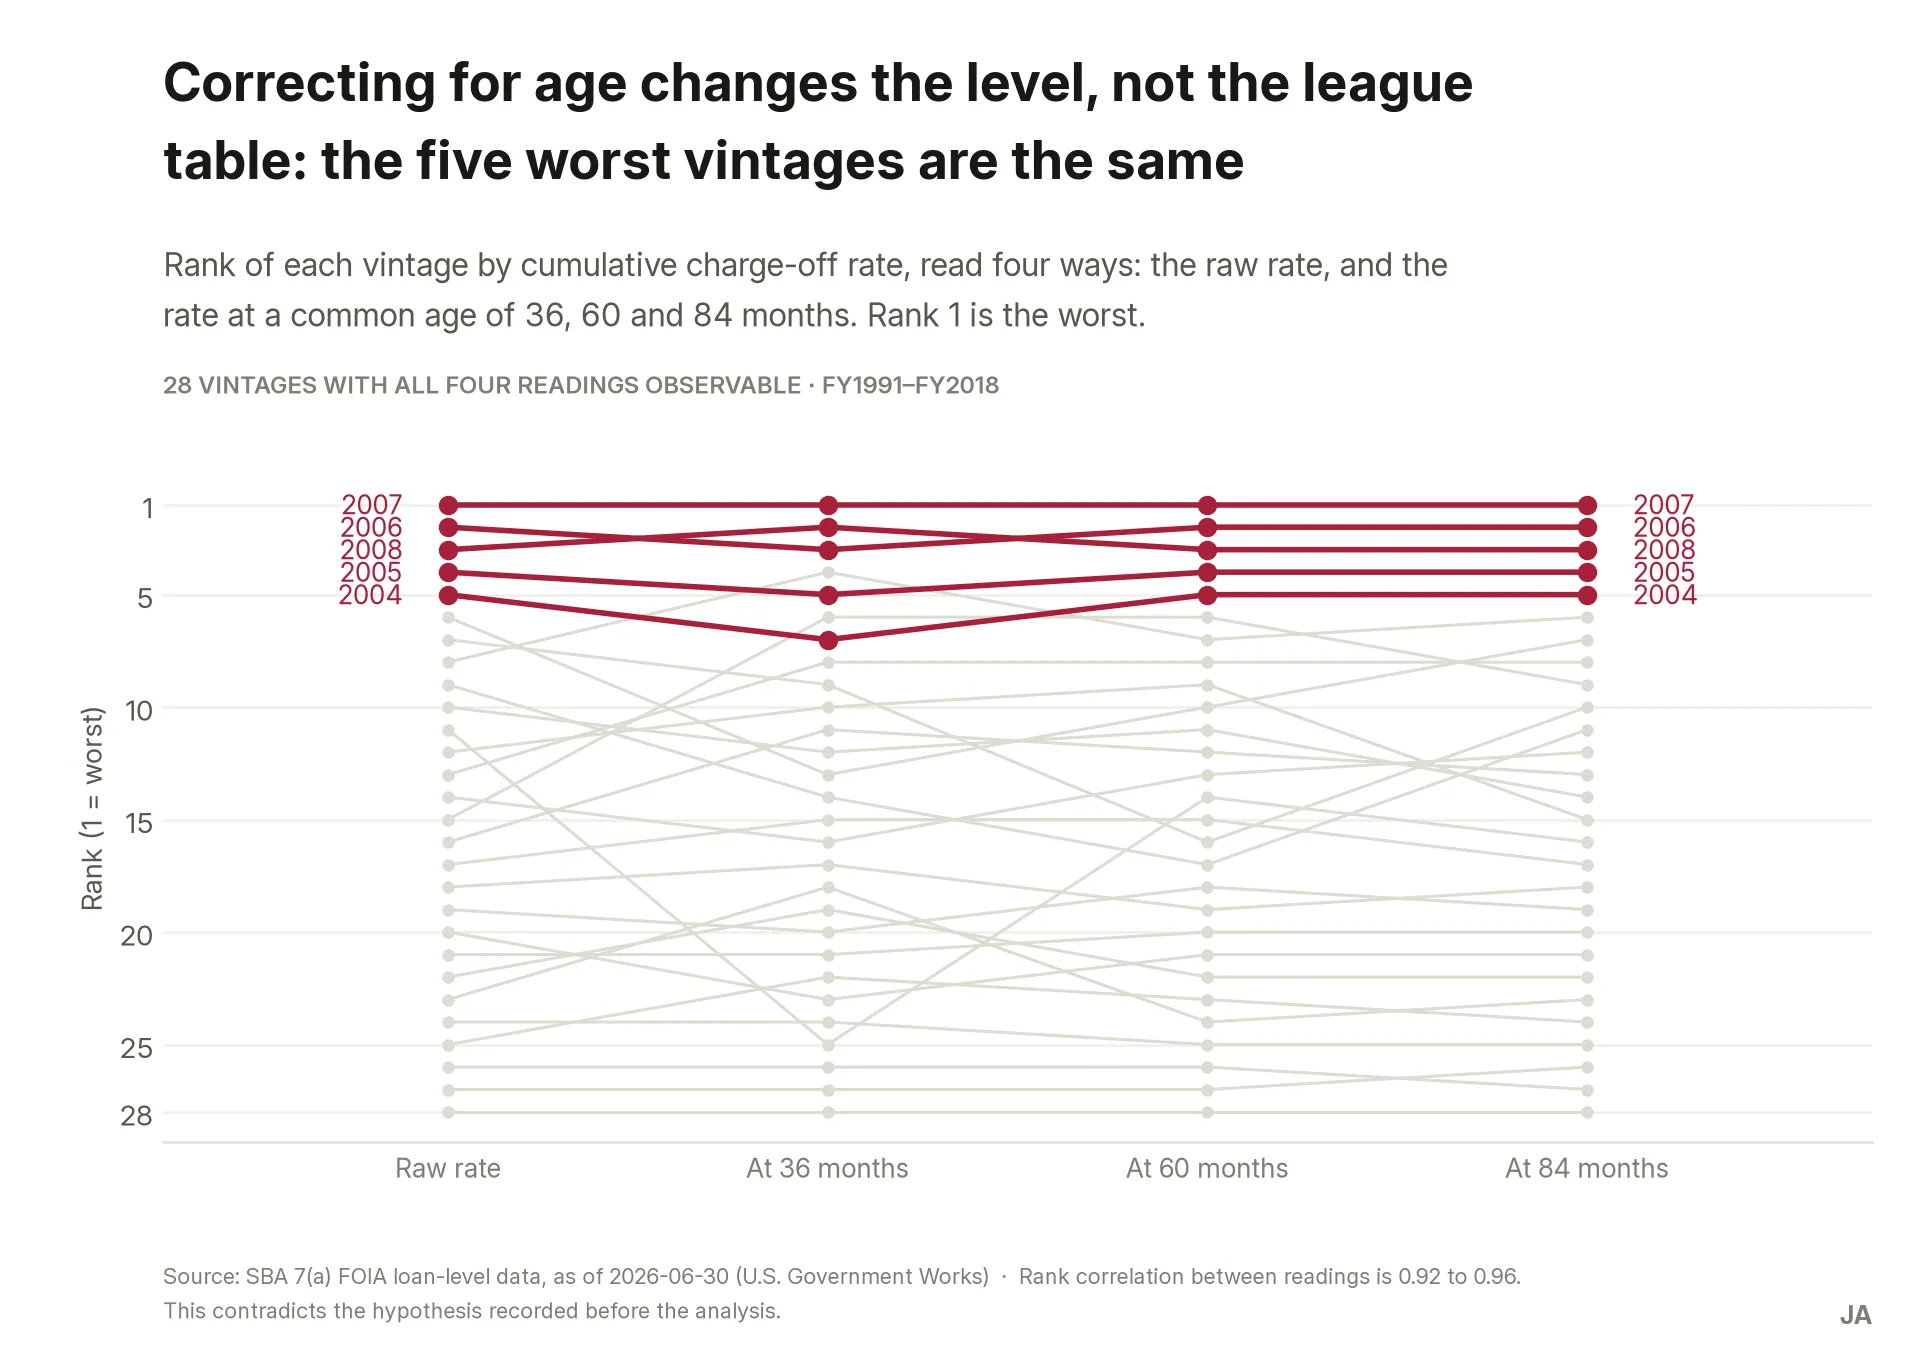
What the correction does not do is reshuffle the league table. I wrote down the opposite before starting: that reading vintages at equal age would reorder them. It does not. Rank correlation between the raw ranking and the equal-age ranking is 0.92–0.96, and the five worst vintages are the same either way.
That contradiction sharpens the case rather than weakening it. The mistake a fund makes is not ranking the wrong vintage worst — it is believing a young vintage’s number.
Every one of these survived a check that could have killed it: that the pattern is loan size rather than vintage (rank correlation 0.94 between count- and dollar-weighted rates), that it is a change of origination mix rather than of vintage (0.97 after standardising on a fixed term-and-size mix), and that it depends on which common age is chosen (0.92–0.96 across 36, 60 and 84 months). The curve itself was recomputed by direct counting instead of a windowed cumulative sum: zero discrepancies.
Recommendations
Price the book off a maturation curve, not off its observed rate. For a 2023-like book the loss input moves from 0.75 to 4.24 cents per dollar approved — the uncorrected figure understates by a factor of 5.7. Low effort: a change of input plus a quarterly re-run. What must be true is that the loss timing of 1991–2014 still holds; if today’s borrowers fail on a different schedule the method is wrong in a way it cannot detect on its own, which is why the re-run matters more than the number.
Keep 2020 and 2021 out of any calibration sample, and use 2016–2019 as the modern reference window. Including them pulls a 2016–2021 average at 36 months from 1.83% down to 1.49%.
Underwrite the short-term, small-ticket segment on its own terms. At 60 months, loans of seven years or less charge off at 5.67% against 0.39% for loans over twenty years — fourteen times. But term is a proxy for product and collateral: 20-year 7(a) loans are real-estate secured and short ones are working capital. This says where the loss sits, not that tenor causes it. Acting on it means choosing which business to be in, or pricing each properly; it does not mean changing a tenor field.
The full cards — each with its evidence, expected impact, measurement, risk and effort — are in the repository, along with what deliberately did not become a recommendation and why.
Reproduce
# 1. Clone
git clone https://github.com/BobbyTarantino099/sba-loan-vintages.git
cd sba-loan-vintages

# 2. Dependencies
pip install -r requirements.txt

# 3. Rebuild the raw files (~901 MB, not versioned)
#    SBA overwrites the same URLs every quarter, so the sha256 in
#    documentacion/fichas-de-fuente.md are what tell you whether you rebuilt the
#    same data. If they differ, procesar.py stops: it asserts the phase 2 counts.
python notebooks/descargar.py

# 4. Run in order — each step consumes the previous one's output
python notebooks/procesar.py    # runs consultas/01 and 02 -> datos/limpios/*.duckdb
python notebooks/analizar.py    # runs consultas/03 to 05  -> salidas/tablas/
python notebooks/verificar.py   # the checks, V0 to V6
python notebooks/graficos.py    # the figures -> salidas/graficos/
python notebooks/build_docx.py  # the executive summary
The full phase-by-phase log, the cleaning log with every discarded alternative, the ROCCC source records and the verification blocks live in the repository.
What this demonstrates
The reflex that separates a credit analyst from someone who can group rows in SQL: knowing that a raw default rate is not comparable across cohorts of different ages, and correcting it. It is not a difficult calculation. It is a difficult habit, because the uncorrected number is always available and always looks fine.
The part I most want to show, though, is the refusal. The method produces a number for the 2025 vintage — 3.0%, from multiplying a 0.005% observed rate by a development factor of 606. Publishing it would have made the case look more complete and would have been the same mistake the case spends four charts exposing. So the two youngest vintages are published as a labelled gap, and the threshold that put them there was set after seeing the factors explode, which is stated rather than hidden.
Underneath both: the finding that made the whole thing possible was reading the data dictionary
properly. EXEMPT is the field an analyst discards as “outcome unknown”. It is the publisher
handing over the censoring indicator, and everything else follows from noticing that.
Explore the vintages yourself
Every vintage from 1991 to 2025, drawn together. Each line stops where its vintage stops being readable — which is why the recent ones are so short. That truncation is the whole problem: a vintage that has not lived long enough cannot be compared with one that has.