Video games
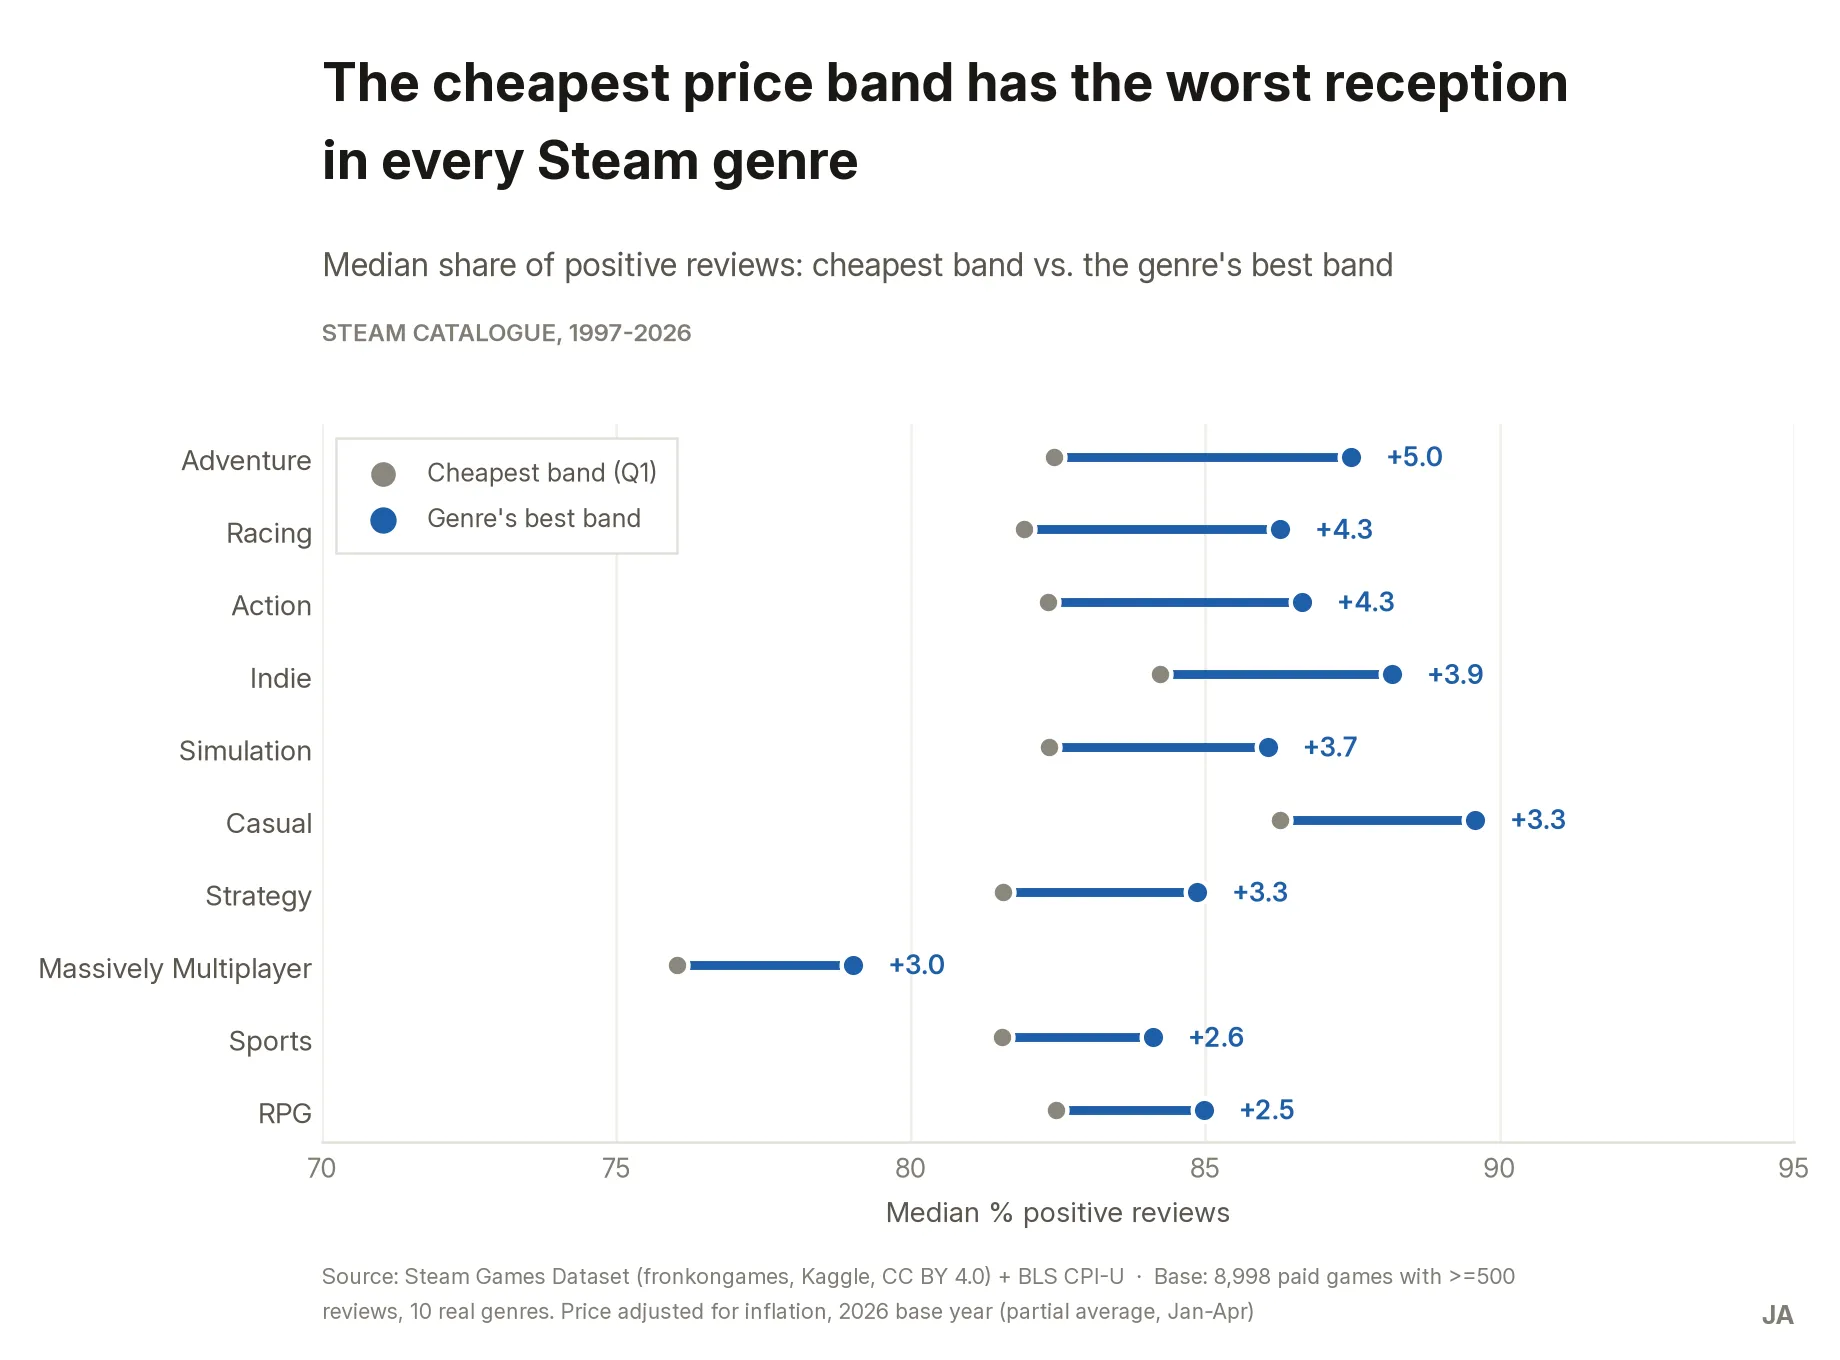
On Steam, the cheapest price band has the worst reception across all 10 genres
Games priced under a real $3.25 systematically get the worst reception in their genre. The best reception sits at $6.46-$12.36 — never the cheapest, and not always the most expensive either. Based on that, I recommend concentrating due diligence on Adventure, Indie and Casual.
Context
A video-game-focused investment fund has no data-driven basis for deciding which genre to prioritise for its thesis in the PC/Steam market. It has more candidates than filters: the operating question isn’t “is this a good game?” but “where in the catalogue is due diligence time best spent?”.
The analytical question I framed: which genre and price-band combinations (inflation-adjusted price quartiles, over paid games with ≥500 reviews) in Steam’s historical catalogue show the most consistent pattern of high positive-review share, controlling for game age? The decision this unlocks is concrete: recommend 2-3 genres where the committee should prioritise due diligence, with evidence of which price band sustains the best reception in each.
Data
| Source | Period | Volume | Licence |
|---|---|---|---|
| Steam Games Dataset (fronkongames) | 1997-06-30 → 2026-05 | 125,855 games × 40 columns | CC BY 4.0 |
CPI-U, series CUUR0000SA0 (US Bureau of Labor Statistics) |
1997-2026 | Annual index | Public domain |
The raw CSV is ~400 MB and is not stored in the case repository — it is downloaded from the Kaggle link (see Reproduce). CC BY 4.0 requires attribution: fronkongames dataset, Kaggle. No PII in either source.
Main limitations:
- No causality. The pattern is a descriptive correlation. The strongest alternative reading — that studios charging more also invest more in production — cannot be ruled out with this data. What I did rule out with evidence is that it’s an age artefact.
- No revenue or sales data.
estimated_ownerscomes as SteamSpy-estimated ranges, not Valve-confirmed figures, and was not used as a metric. This case speaks to reception, not profitability. - The long tail is excluded. The ≥500-review filter deliberately excludes 34.1% of the catalogue, which has zero reviews. The sample is biased toward visible games.
- Survivorship bias. Only games that shipped on Steam. Not cancelled titles, not delisted ones, not console or mobile.
Process
Tools: Python with pandas. The file is 400 MB with a structural header bug — auditing it by hand in a spreadsheet was not viable, and the case required the cleaning to be reproducible end to end.
Key cleaning decisions:
- Fixed a header bug. The raw header declares 39 columns but every row carries 40: the name
DiscountDLC countmerges two real columns,DiscountandDLC count. Everything past that position was misaligned. Fixed by inserting the missing name before loading. - Inflation adjustment instead of a declared limitation. I combined the catalogue with the BLS CPI-U to compare, in real 2026 dollars, prices of games released 29 years apart. A $9.99 game from 1999 is not the same product as a $9.99 game from 2025.
- Exploded by genre. A game with N genres produces N rows, so each genre gets its own evidence. 117,430 games → 338,575 game-genre rows.
- Cleaned the genre taxonomy. Steam’s
Genrescolumn mixes real genres with content descriptors (Violent,Gore), non-game software tags (Accounting,Utilities) and business model (Free To Play,Early Access). I excluded the 23 tags that are not a video game genre and kept the 10 real ones.
Count reconciliation: 125,855 − 2 (future release date) − 0 (duplicates) − 8,423 (no genre) =
117,430, verified with an assert in the script. Final analysis base: 9,048 paid games with
≥500 reviews.
Findings
1. The cheapest band has the worst reception in all 10 genres, without exception
The median positive-review share in Q1 (≤$3.25 real) ranges from 76.0% in Massively Multiplayer to 86.3% in Casual, and across all ten genres it is the lowest or tied for lowest in its genre. There is not a single genre where the cheapest band gets the best reception.
2. The peak sits at mid-to-high prices, not the highest price
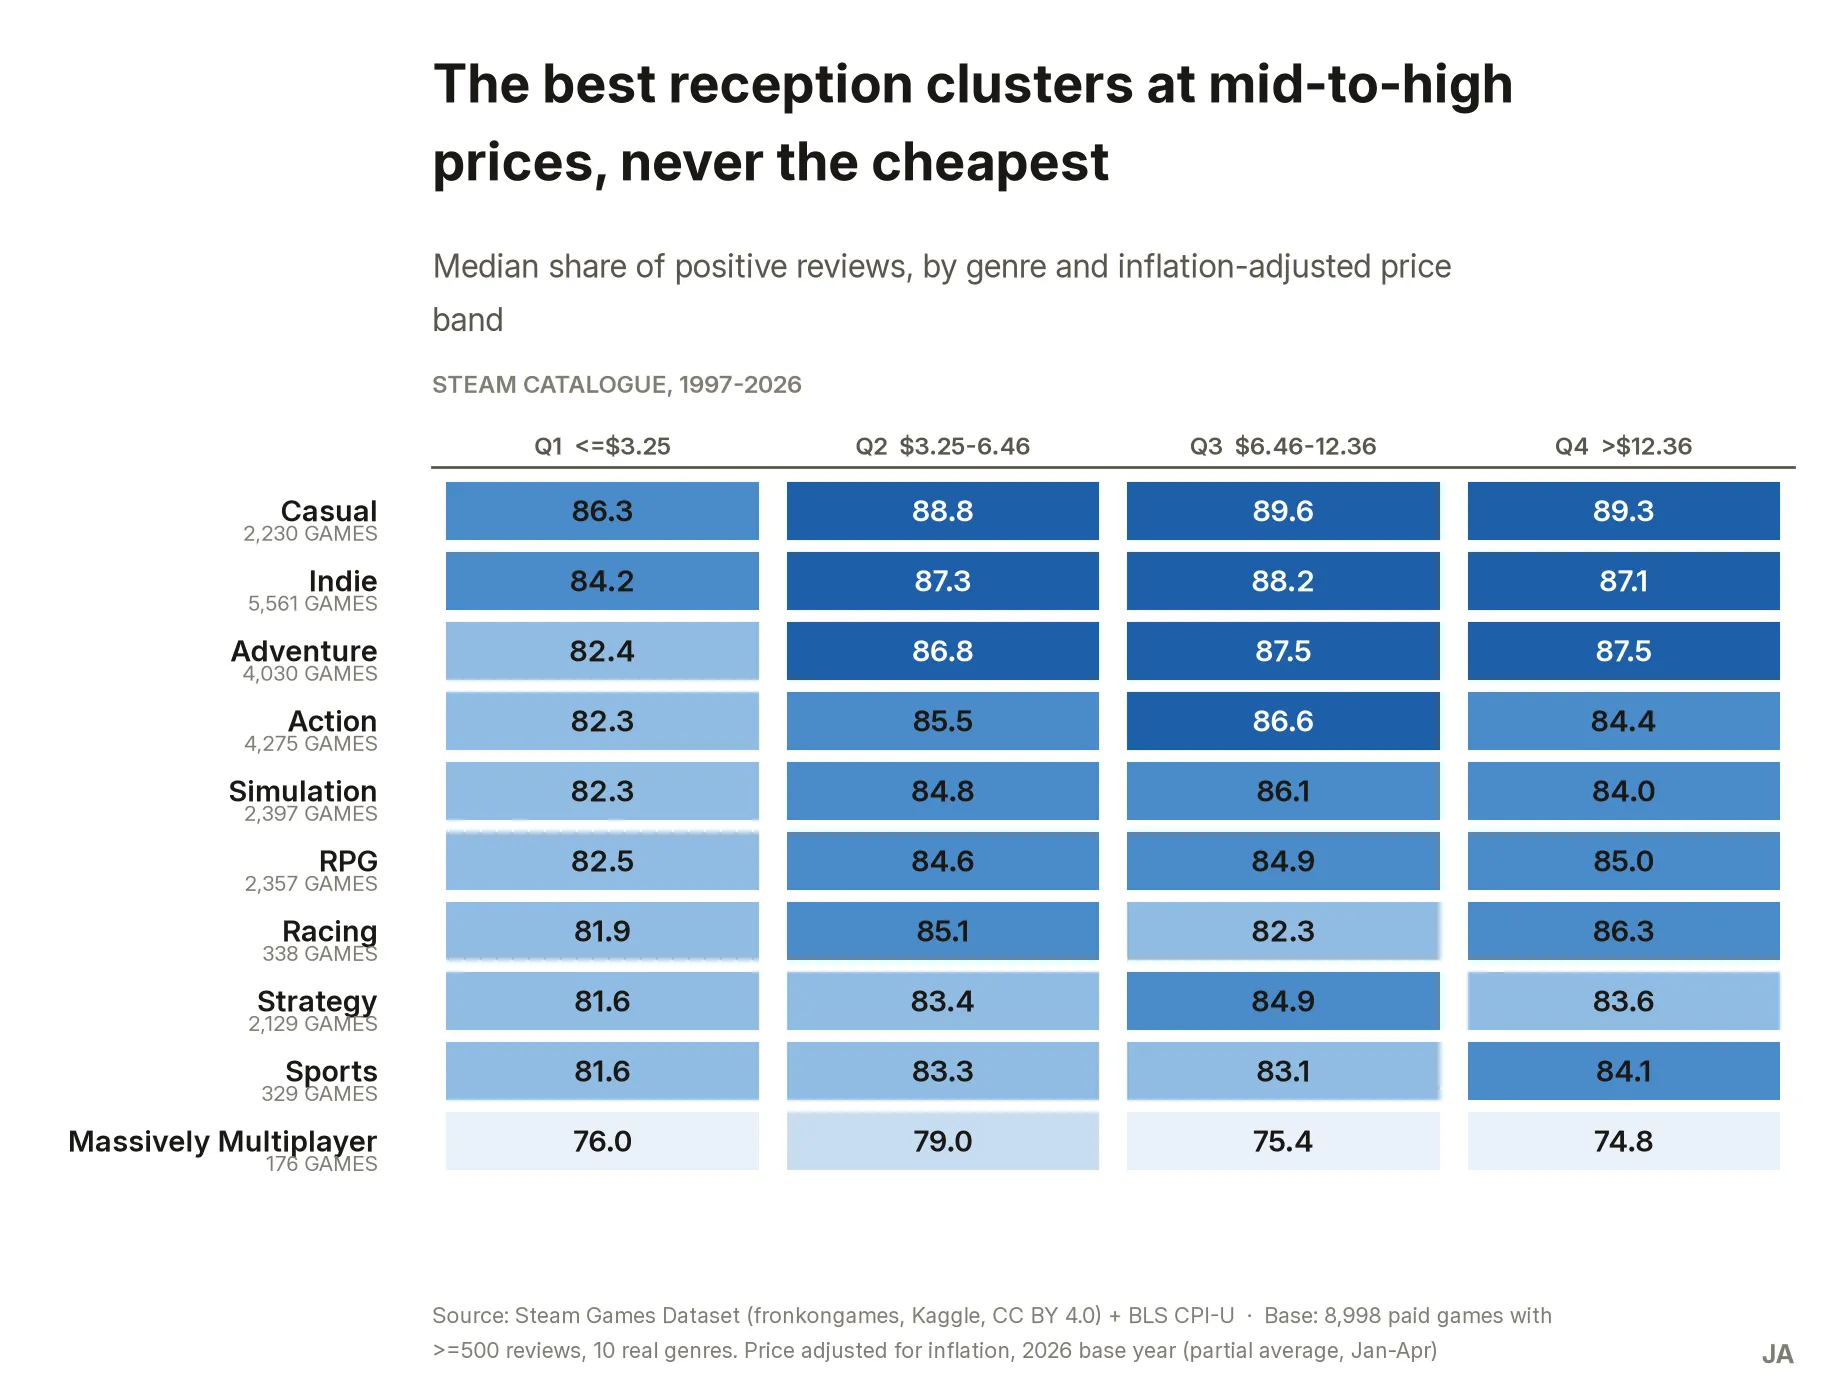
Where each genre peaks:
- Q3 ($6.46–$12.36) — Action, Indie, Simulation, Casual and Strategy.
- Q4 (>$12.36) — Adventure, Racing, Sports and RPG.
No genre has its best reception in Q1 or Q2. That rules out the simplistic “more expensive is always better” reading too: in half the genres, the most expensive band already trails Q3.
3. The effect is real but moderate: 2.50 to 5.04 percentage points
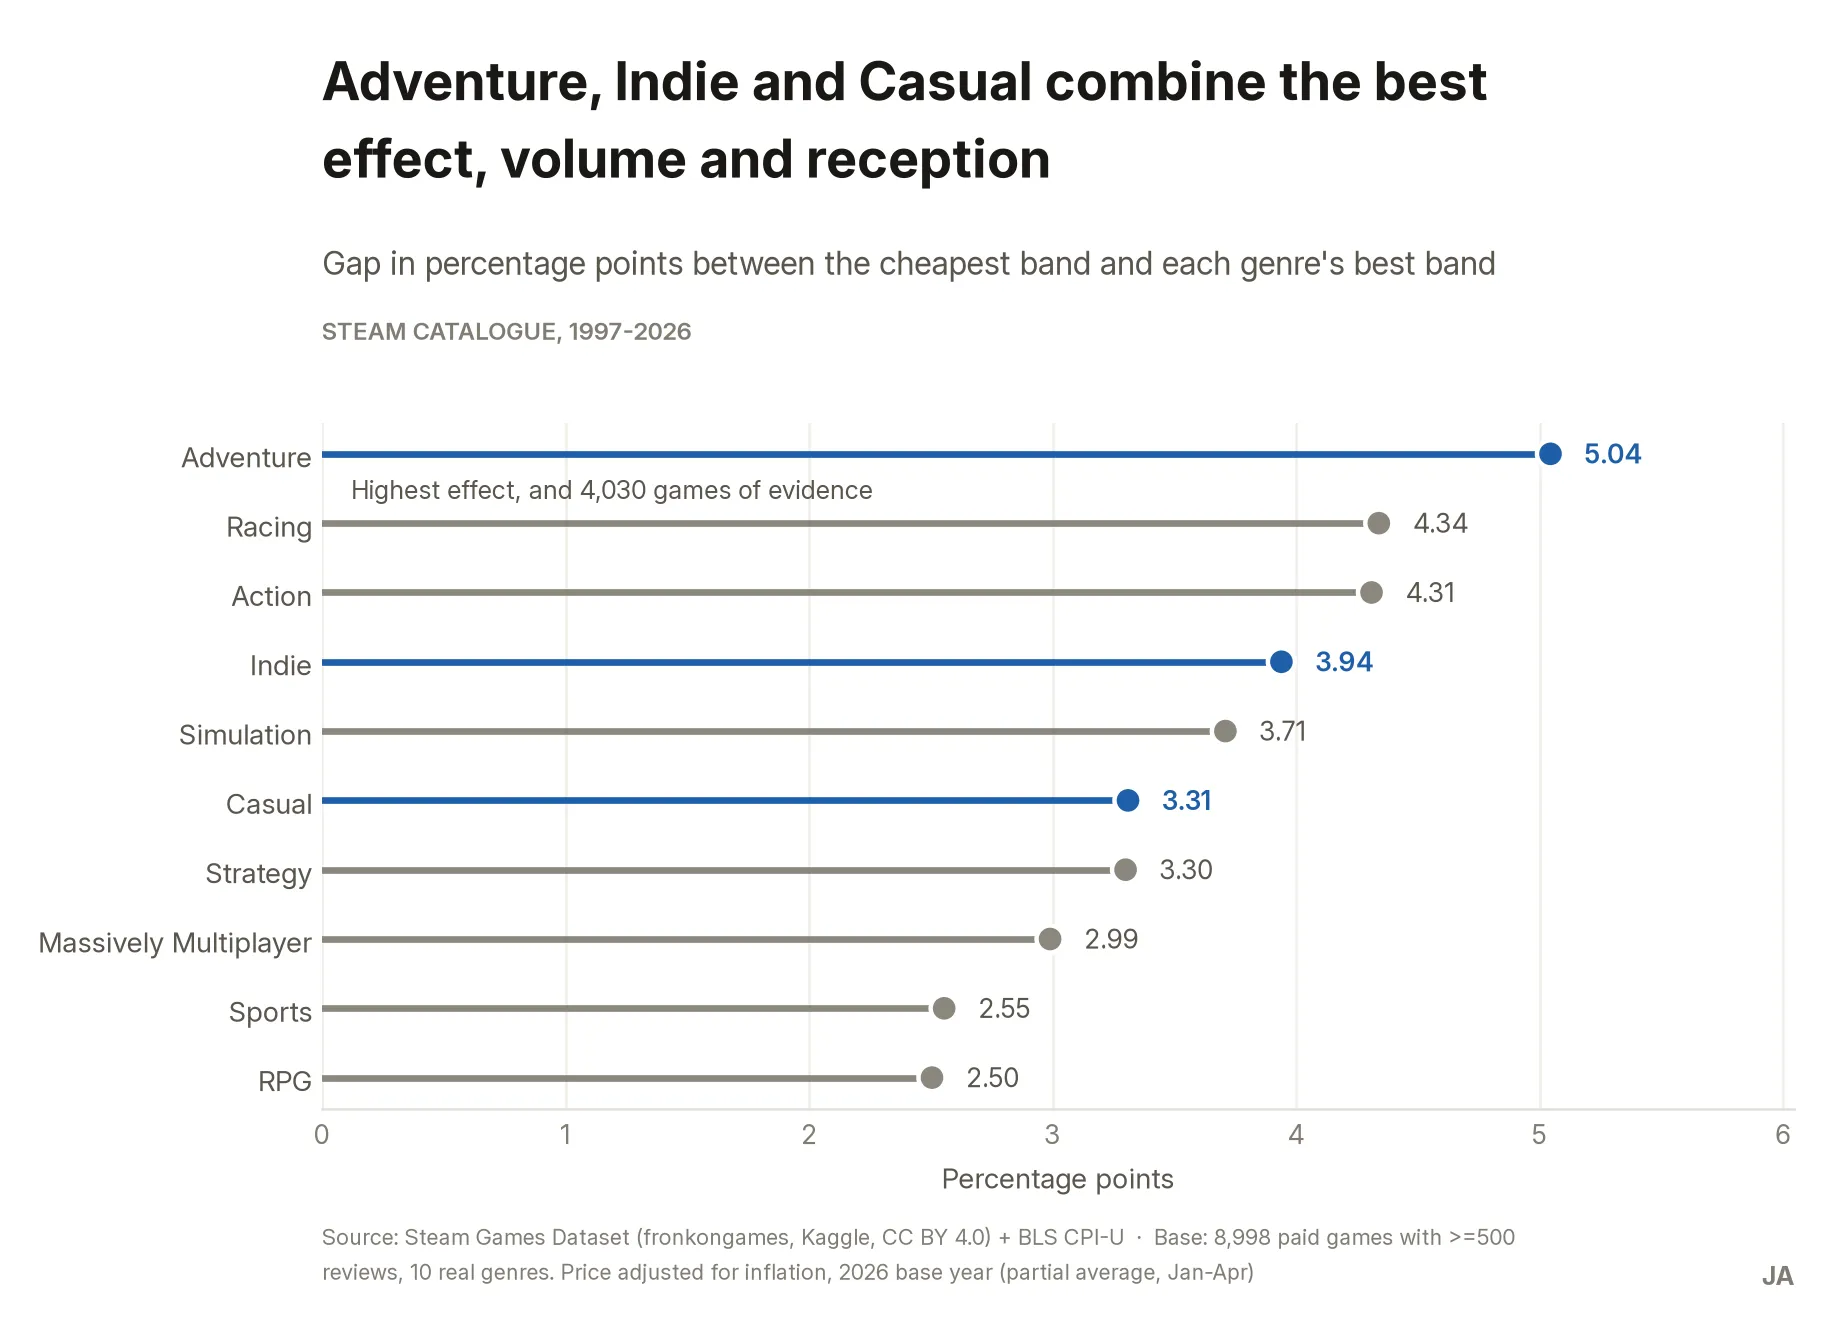
The gap between Q1 and each genre’s best band ranges from 2.50 p.p. (RPG) to 5.04 p.p. (Adventure). Quantifying it matters: it supports a directional screening argument, not a claim that price alone transforms a product’s reception.
Three genres combine the best effect, volume and absolute reception:
| Genre | Games | Median reception |
|---|---|---|
| Adventure | 4,030 | 86.2% |
| Indie | 5,561 | 86.7% |
| Casual | 2,230 | 88.2% |
4. Not an age effect: the pattern holds for both new and old games
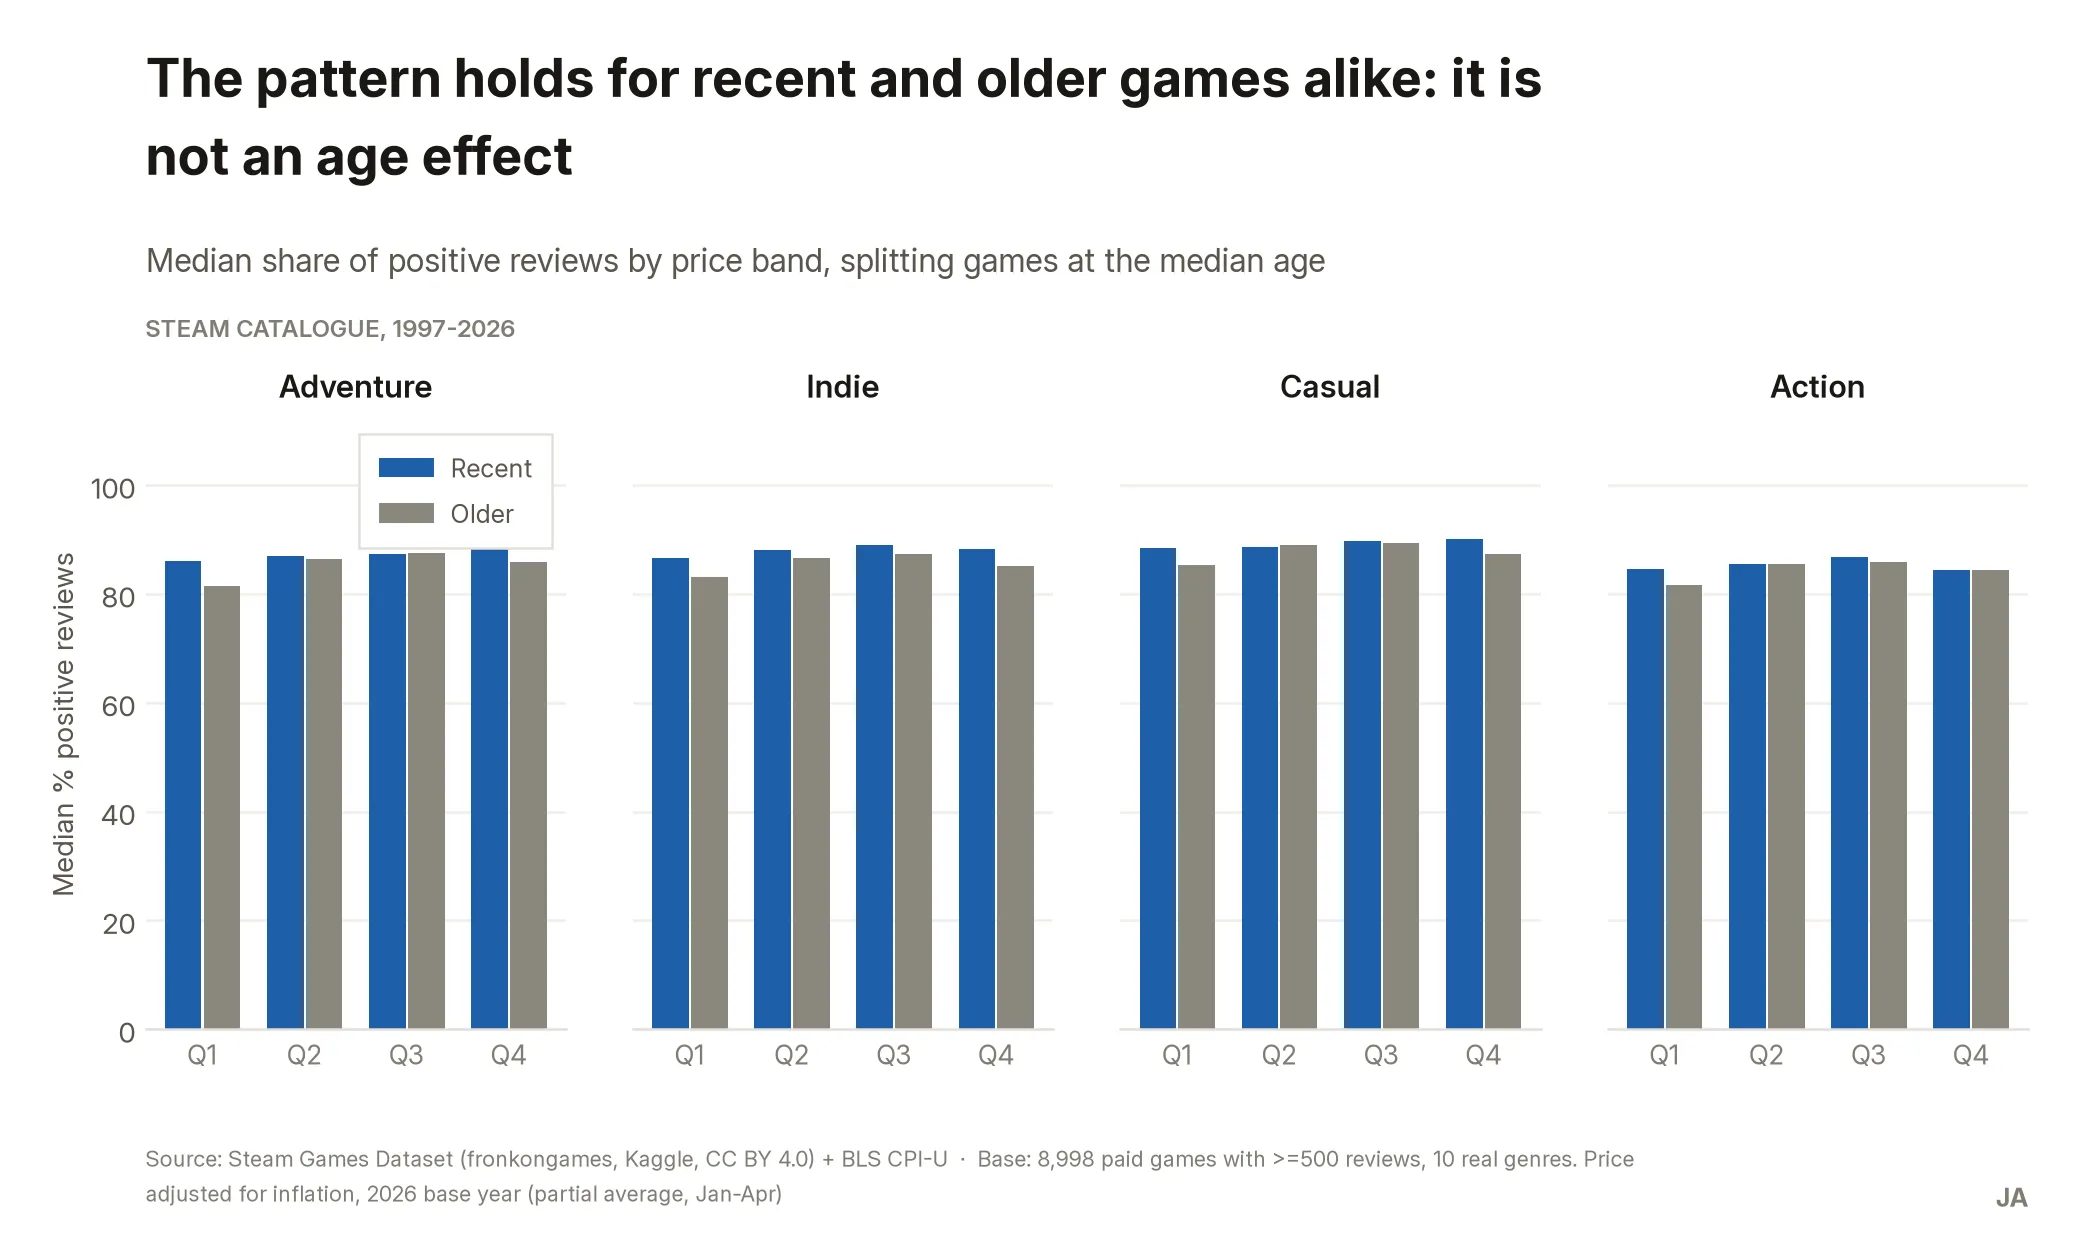
The obvious objection is that cheap games are simply the old ones. It doesn’t hold: the correlation between age and reception is -0.087 (practically null), and when the table is repeated splitting recent games from older ones, “Q1 is the worst band” appears in both groups.
5. Massively Multiplayer is the exception, and is reported as such
It has no chart of its own, deliberately. It’s the only genre with a non-monotonic pattern (its best band is Q2), has the lowest median of the ten across all four bands (74.8%-79.0%), and the smallest n in the base (176 games). The evidence is weak, so it is neither recommended nor dismissed: it is documented as insufficient.
Recommendations
| # | Recommendation | Evidence | Impact | Effort |
|---|---|---|---|---|
| R1 | Concentrate next cycle’s due diligence on Adventure, Indie and Casual | The three highest reception medians (86.2 / 86.7 / 88.2%) + price-band effect of 3.31-5.04 p.p. + sufficient target volume | High | Low |
| R2 | Add the catalogue’s position in the price quartiles to screening; flag studios with >50% in Q1 for review | Q1 is the worst band across all 10 genres; the pattern survives the age control | Medium | Low |
| R3 | Deprioritise Massively Multiplayer this cycle; Sports and Racing as “insufficient evidence” | MMO: 76.4% median, non-monotonic pattern, n=176. Sports (329) and Racing (338) below the n<350 threshold | Medium | Low |
All three are low-effort because all three are rules layered on a process the fund already runs. That’s deliberately the ceiling of what this analysis can support: with aggregated reviews and no revenue data, the honest recommendation is where to look first, not where to put the money.
Main next step: lower the review threshold to 50 and 100 to see whether the pattern holds in the indie/niche long tail. That unlocks the decision of whether the fund should open an investment lane for small studios.
Reproduce
# 1. Clone
git clone https://github.com/BobbyTarantino099/steam-price-reception.git
cd steam-price-reception

# 2. Dependencies
pip install pandas matplotlib seaborn jupyter

# 3. Download the raw file (not in the repo, ~400 MB)
#    https://www.kaggle.com/datasets/fronkongames/steam-games-dataset
#    Save it as:
#    datos/crudos/steam_fronkongames_catalogo-historico_2026-07-28.csv
#    The CPI-U file is already at datos/crudos/bls_cpi-u_anual_1997-2026_2026-07-28.csv

# 4. Run in order
python notebooks/procesar.py    # cleaning -> datos/limpios/
python notebooks/analizar.py    # quartiles and genre x band table -> salidas/tablas/
python notebooks/verificar.py   # the 7 analysis checks
python notebooks/graficos.py    # the 4 figures -> salidas/graficos/
What this demonstrates
Turning an investment question into a pricing-and-sentiment analysis, on a dataset with a real structural flaw — not trivial nulls, but a broken header that misaligns columns — and combining it with a second source (CPI-U) to compare prices across 29 years in real dollars.
What I most want to show here is the part that’s usually missing: ruling out the alternative explanation before publishing the finding. The obvious objection to “cheap games get worse reception” is that cheap games are the old ones. I checked, it doesn’t hold, and that check is in the repository with its code. And the genre that didn’t fit the conclusion — Massively Multiplayer — is reported as insufficient evidence instead of being left out.